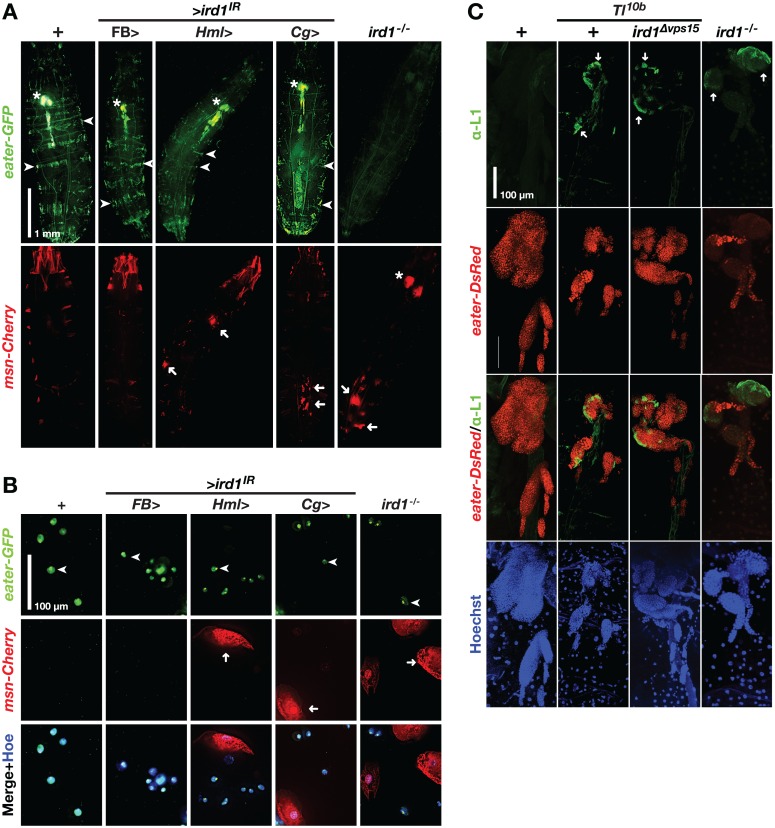
Fig 4. ird1 loss-of-function in hemocytes triggers lamellocyte formation.
A. Effects of ird1 suppression or loss of function on the distribution of hemocytes. Upper panels show plasmatocytes, as visualized with the plasmatocyte marker eater-GFP. Lower panels show lamellocytes in the same animals, as visualized with the msn-mCherry marker. Strong ectopic expression of the latter marker is also seen in parts of the larval musculature, especially in the head region. Arrowheads: sessile hemocyte bands; asterisks: lymph glands; arrows: nodules. B. eater-GFP and msn-mCherry marker expression in plasmatocytes (arrowheads) and lamellocytes (arrows) extracted from the circulating blood cell population of larvae having the same genotypes as in A. C. Effects of ird1 loss of function on hemocyte distribution in lymph glands of Tl10b and Tl wild-type larvae. Plasmatocyte reporter eater-DsRed and nuclear Hoechst staining (blue) visualize the entire organ whereas the L1 antibody marks lamellocytes (arrows). Between 8–10 lymph glands per genotype were analyzed. Hemocytes in B are imaged by regular fluorescence microscopy, whereas lymph gland images in C are maximum intensity projections of z-stacks generated by confocal microscopy.

