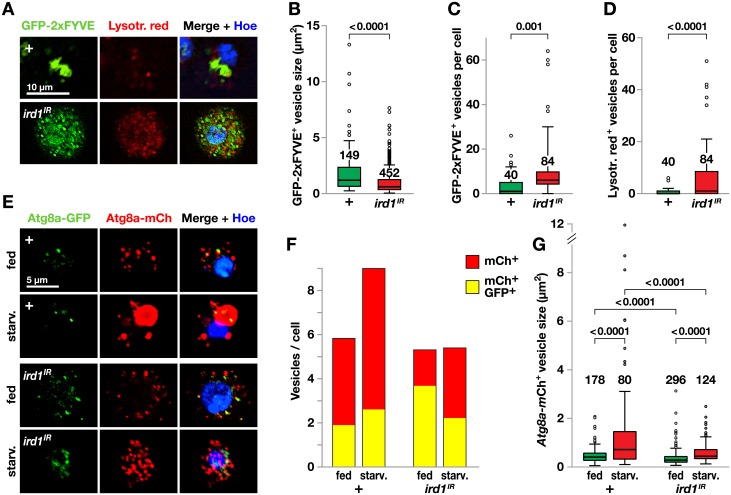
Fig 6. ird1 expression in plasmatocytes is required for endosome homeostasis and starvation-induced autolysosome formation.
A. The binding of HmlΔ-GAL4-driven UAS-GFP-Myc-2xFYVE to the product of the Ird1-Vps34 kinase complex visualizes early endosomes and multivesicular bodies (green) in control and UAS-ird1IR plasmatocytes from fed larvae only. Hemocytes were also stained with pH sensitive dye Lysotracker red to visualize autolysosomes and with Hoechst. B-D. Quantification of sizes (B) and numbers of GFP-staining (C) or Lysotracker red-staining (D) vesicles in images of the indicated number of plasmatocytes from larvae of the same genotypes as in A. E. HmlΔ-GAL4 driven UAS-mCherry-GFP-Atg8a visualizes intracellular vesicles in plasmatocytes from control (+) and UAS-ird1IR-expressing larvae that were either starved for 3h or kept on standard food. Hoechst permanently stains the nucleus (blue) while GFP (green) fluorescence is quenched in lysosomes due to the low pH, making the mCherry (red) fluorescence a marker for Atg8a in autolysosomes. GFP (green) fluorescence marks Atg8a presence elsewhere. F. The number of vesicles with red only or red and green fluorescence was counted separately for each hemocyte in 7–14 microscopic fields (35–111 cells) per experimental condition. The bars show the average number of vesicles of each category per cell. See S5 Fig for more detail. G. Size distribution of mCherry+ vesicles, measured in images of the indicated number of plasmatocytes. Box-plots depict medians, quartiles and outliers, and P values for pairwise comparisons are indicated above. The latter were calculated using Kruskal-Wallis ANOVA (G) or two-tailed Mann-Whitney U exact tests (B-D).

