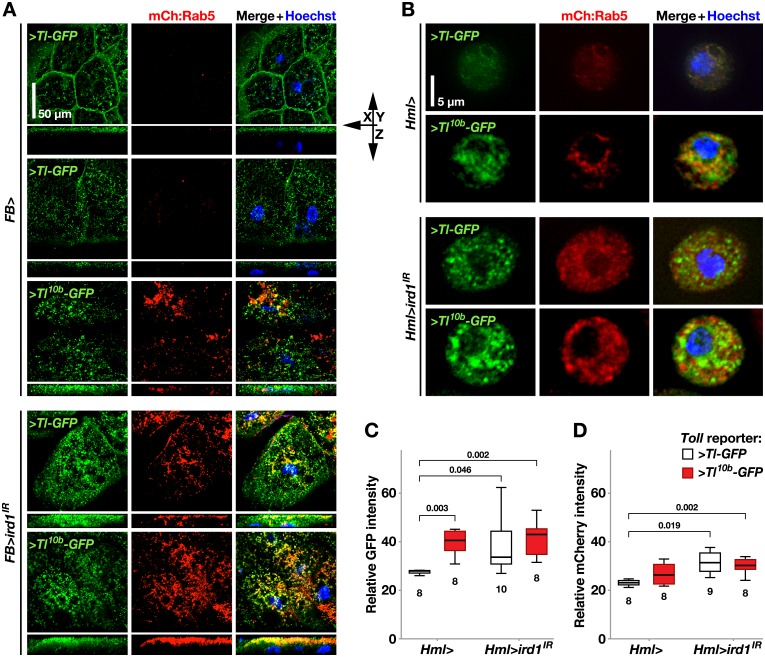
Fig 7. Suppression of ird1 or activation of Toll signaling cause similar re-localization and accumulation of Toll-GFP fusion protein and early endosomes.
A. FB-GAL4 driven UAS-Tl-GFP (>Tl-GFP) fusion construct and mCherry-Rab5 (mCh:Rab5) reporter are used to visualize the localization and relative quantity of Toll receptors (green) and early endosomes (red) in fat bodies extracted of otherwise wild-type (+) or UAS-ird1IR-expressing (>ird1IR) larvae and stained with Hoechst nuclear dye (blue). Using a UAS-Tl10b-GFP (>Tl10b-GFP) construct, the same structures are also visualized under conditions of an activated Toll pathway. B. HmlΔ-GAL4 driving the expression of the same fusion and reporter constructs, to visualize Toll receptor and early endosome localization in plasmatocytes. C-D. Relative signal intensity of GFP (C) and mCherry (D) in hemocyte samples as in B, with either the >Tl-GFP (white boxes) or >Tl10b-GFP fusion constructs (grey boxes). Box-plots in C and D depict medians, quartiles and outliers measured by software in the indicated number of images, containing 3–12 plasmatocytes each. The P values indicated above were calculated for pairwise comparisons using Kruskal-Wallis ANOVA. For fat bodies, maximum intensity projections of z-stacks are shown, whereas hemocyte images were made with regular fluorescence microscopy.

