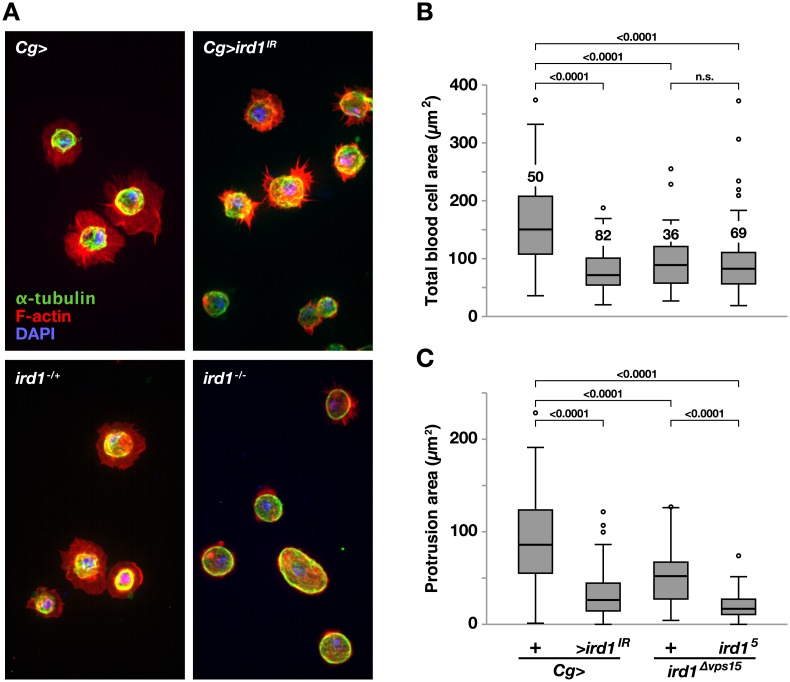
Fig 8. Blood cell protrusion formation requires ird1.
A. Hemocytes expressing UAS- ird1IR with Cg-GAL4 (Cg>ird1IR), driver control hemocytes (Cg>) and hemocytes extracted from ird1Δvps15 heterozygote (ird1-/+) or ird1Δvps15/ird15 null (ird1-/-) larvae. Ex vivo hemocytes spread on glass slides were stained with DAPI nuclear dye (blue), AlexaFluor 594- conjugated F-actin-phalloidin (red) and FITC-conjugated α-tubulin antibody (green). B. Total area and C. protrusion area of hemocytes with the same genotypes as in A. Protrusion area is calculated by subtracting the α-tubulin stained region from the total surface spread area stained with phalloidin for each cell using the ImageJ software. Box-plots in B and C depict medians, quartiles and outliers with the number of analyzed blood cells for each genotype indicated in B. P values for pairwise comparisons using Kruskal-Wallis ANOVA are indicated above horizontal bars in B and C. Blood cell images are maximum intensity projections of z-stacks.

