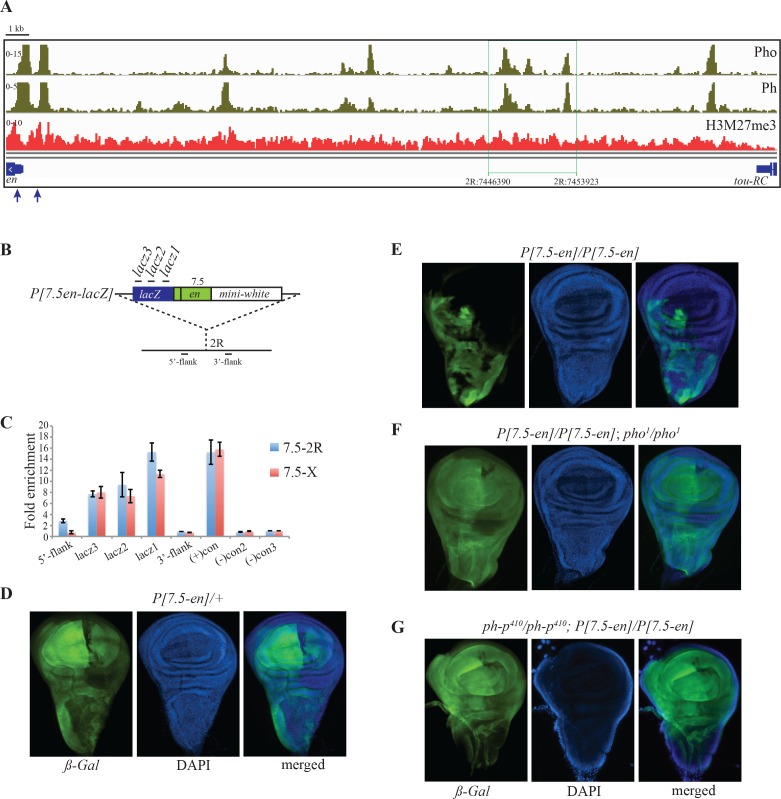
Fig 6. A transgene containing small Pho/Ph peaks is PcG regulated.
(A) An overview of ChIP-seq distribution of Pho, Ph and H3K27me3. Characterized en-PREs are indicated with blue arrows. A 7.5kb fragment (2R:7446390..7453923) with weak Pho/Ph peaks used for transgenic assay is shown by green box. (B) Diagram of the transgenic construct containing the 7.5kb fragment. (C) Quantification of H3K27me3 over lacZ in two transgenic lines (7.5-2R and 7.5-X) is shown; primer sites are shown in B. H3K27me3 levels from fragments ~1kb upstream and downstream of the insertion site at chromosome 2R are also shown. Results are shown as fold enrichment over control signal and are the average of three independent biological samples with three replicates each (mean±SEM) (primer details in S2 Table). (D) ßgal and DAPI staining of wing imaginal disc from a larvae heterozygous for P[7.5en-lacZ]. (E) ßgal and DAPI staining of a wing imaginal disc from a larvae homozygous for P[7.5en-lacZ]. (F) ßgal and DAPI staining of a wing imaginal disc from a larvae homozygous for P[7.5en-lacZ] in a pho1 mutant. (G) ßgal and DAPI staining of a wing imaginal disc from a larvae homozygous for P[7.5en-lacZ]; in a ph-p410 mutant.

