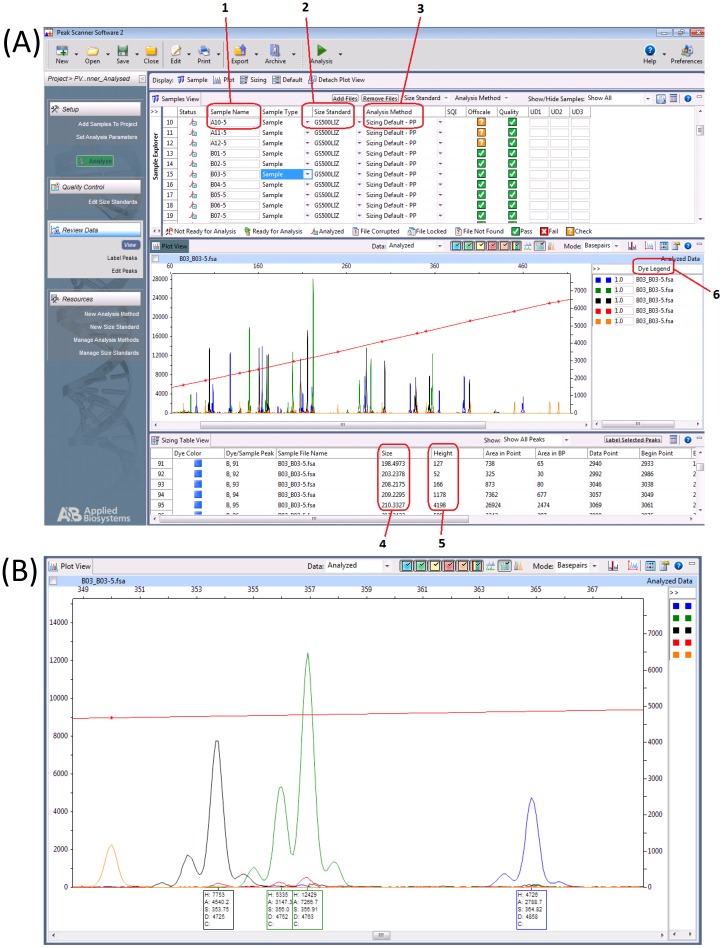
Fig 1. Analysis of multiplex fragment analysis data in PeakScanner.
(A) PeakScanner application layout. Labels 1–6 refer to: 1, Sample Name, well location in the 96-well plate; 2, Size Standard, name of size standard as selected from the drop-down menu; 3, Analysis Method, analysis method name, e.g. PP—Primers Present, assumes primers have not been removed from the sample; 4, Size, length of PCR fragment for a specific peak in base pairs; 5, Height, height of each peak indicating fluorescent dye signal strength; 6, Dye Legend, displayed dye colours and relative scale. (B) Enlarged section of Panel A showing how similarly-sized PCR products can be distinguished using different dye colours and the occurrence of flanking peaks around a major peak.

