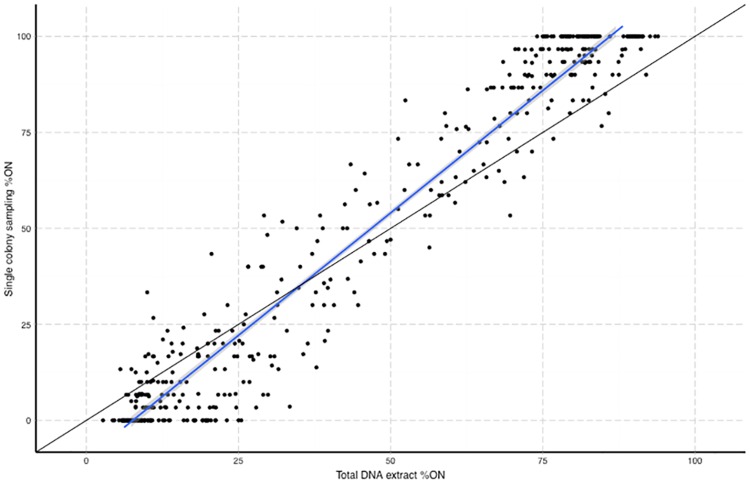
Fig 2. Comparison of two analysis methods for determining the percentage of cells in a population with a gene in an ON state.
The percentage of ON variants in a population was determined by PCR-based fragment analysis of either the relative proportions of peaks obtained using a total DNA extract of the population (x-axis) or from analysis of up to 30 single colonies obtained from serial dilutions of a population (y-axis). The analysis was performed on 16 populations for 28 phase-variable loci. Each circle represents one of the 448 measurements. Black line, line for a 100% correlation between each method. Blue line, linear regression line with 95% confidence interval indicated by shaded area.

