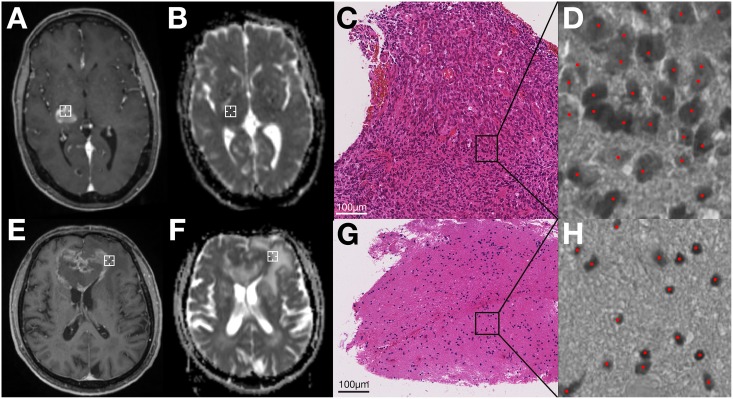
Fig 2. Comparison of two exemplary patients (patient 1: A-D, patient 2: E-H).
A,E: Intraoperative cT1-scans. The biopsy location on this slice is marked by a white crosshair. B,F: Preoperative ADC-maps, which have been registered to intraoperative scans as described. The biopsy location on this slice is marked by a white crosshair. C,G: Scanned biopsy specimens of the respective location (HE stain, x20 magnification). D,H: semi-automatic cell counting on 8-bit images by the ImageJ plugin ITCN. Detected cells are marked with red dots. For patient 1(A-D), analysis yielded ADC = 658mm2/s and cellularity = 16840 cells/mm2. For patient 2 (E-H), it was ADC = 1479mm2/s and cellularity = 2208 cells/mm2.

