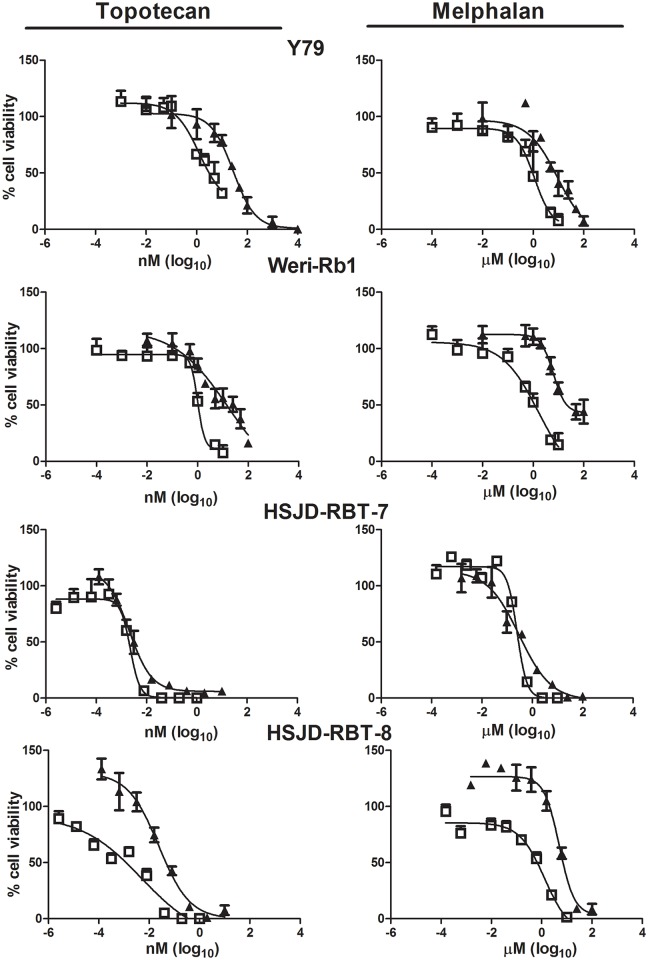
Fig 1. Effect of chemotherapy treatment schedule on retinoblastoma cell proliferation.
Growth inhibition assay performed on Y79, WERI-RB1, HSJD-RBT-7, and HSJD-RBT-8 cell models, respectively, using MTT after 72-h incubation of a conventional regimen (full triangle symbols) and metronomic treatment (open square symbols) for 7 days with different concentrations of topotecan (left) or melphalan (right). All symbols represent % of cell proliferation as compared to untreated control cells, expressed as means (SEM) of three independent experiments, each performed in triplicate.

