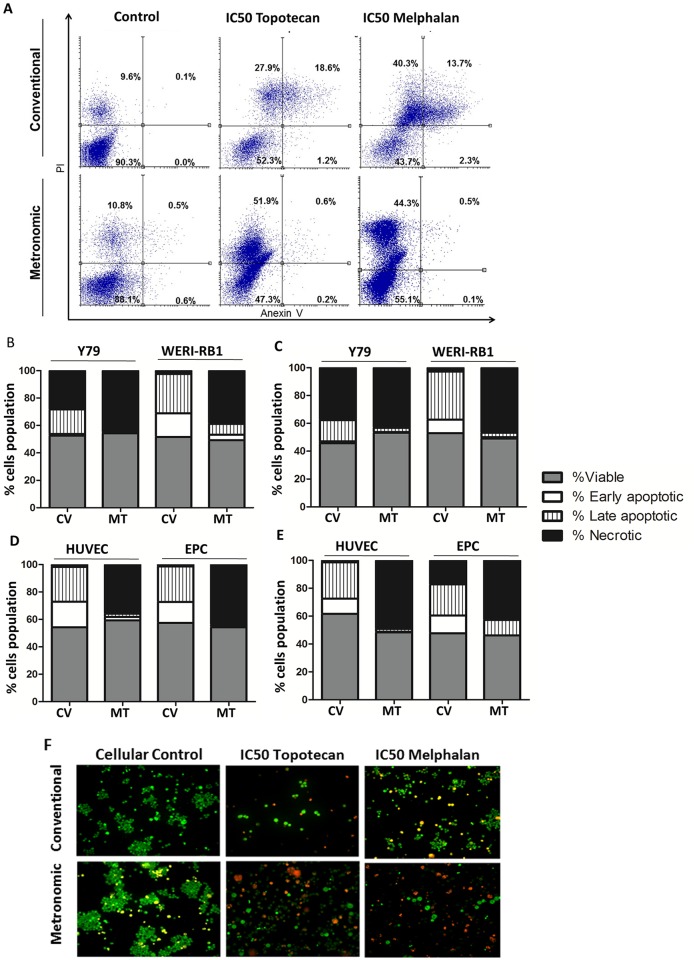
Fig 4. Effect of treatment schedule of chemotherapy on apoptosis of retinoblastoma and endothelial cells.
Retinoblastoma and endothelial cells were cultured at the conventional or metronomic IC50 of melphalan or topotecan. The rate of apoptosis was assessed by flow cytometry after double-staining with Annexin V-FITC and PI. (A) Representative dot plot of Y79 after conventional and metronomic treatment with topotecan or melphalan. Lower left and right quadrants represent viable (Annexin V-/PI-) and early apoptotic (Annexin V+/PI-) cells, respectively; the upper right and left quadrants show late apoptotic (Annexin V+/PI+) and necrotic (Annexin V-/PI+) cells, respectively. Numbers in each quadrant represent percentages of cells. (B, C) Percentages of viable (grey bars), early apoptotic (white bars), late apoptotic (dashed bars), and necrotic cells (black bars) are shown after conventional and metronomic treatment of Y79 and WERI-RB1 with (B) topotecan or (C) melphalan. Thereafter, we studied the impact of (D) topotecan or (E) melphalan conventional and metronomic treatment on HUVEC and EPC apoptosis. (F) Representative images of the morphologic changes of Y79 after conventional (upper row) or continuous treatment (lower row) with melphalan or topotecan observed by fluorescent microscopy (Magnification: 200X). Each experiment was performed in triplicate and repeated three times. Percentages correspond to mean (SD). Abbreviations: CC, control cells; CV, conventional treatment; MT, metronomic schedule.

