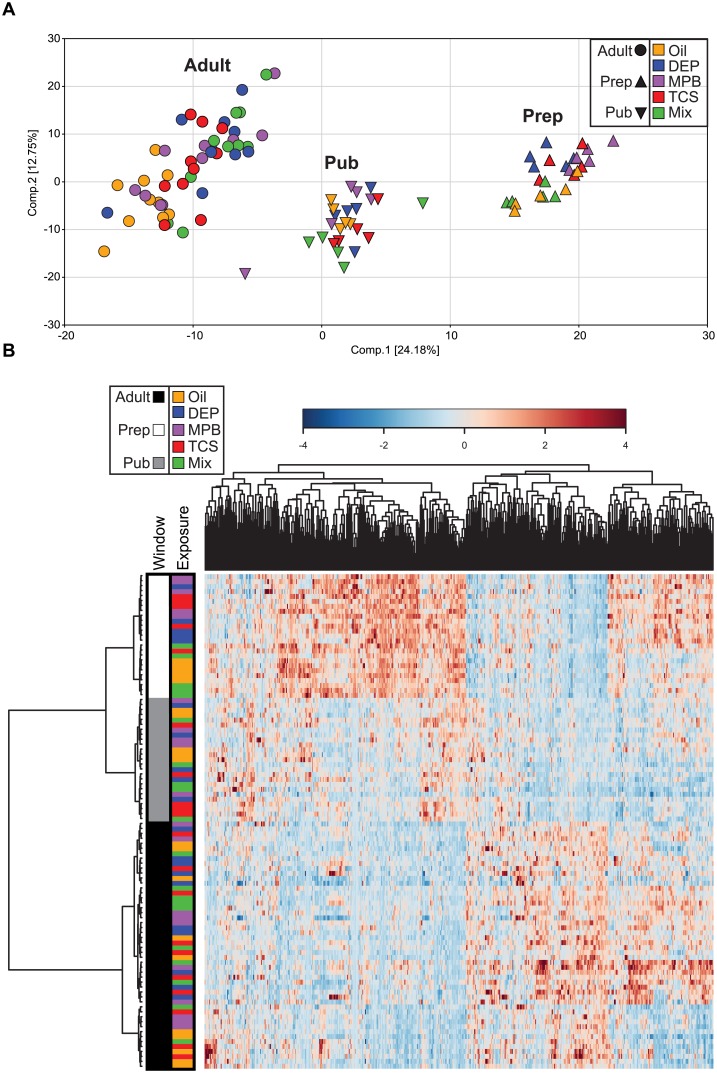
Fig 2. Characterization of the metabolomic dataset.
(A) Principal component analysis showing the first and second component, and the separation of all samples. (B) Heatmap and hierarchical clustering of all samples. The distance measure is Spearman and the clustering algorithm is Ward. The samples are colored by age group and treatment.

