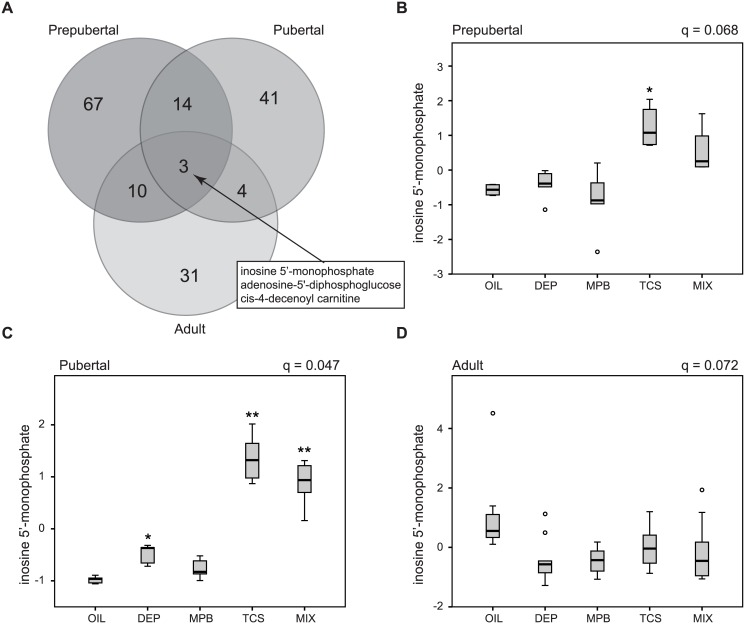
Fig 4. Different sensitivity to personal care product ingredients at the different treatment windows.
(A) Venn diagrams showing overlap in the metabolites that were significantly affected at the three different treatment windows. Inosine 5’-monophosphate levels at the prepubertal (B), pubertal (C) and adult stage (D). The FDR (q) is indicated for each treatment window. The significance of the post hoc comparison of the treatment groups to oil is indicated as follows: ** P < 0.01 or * P < 0.05.

