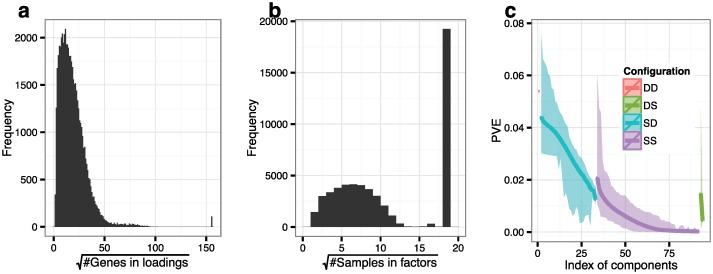
Fig 3. Distribution of the number of genes, the number of samples, and PVE in the breast cancer data.
Panel a: Distribution of the number of genes with non-zero values in each of the 53,814 loadings. Panel b: Distribution of the number of samples with non-zero values in each of the 53,814 factors. Panel c: average PVE for the components sorted by PVE within each run. The middle lines show the median PVE, the ribbons show the range of the minimum and maximum PVE across 900 runs. For panels a and b, the peaks on the far right correspond to the number of the genes and samples for the dense loadings and dense factors.

