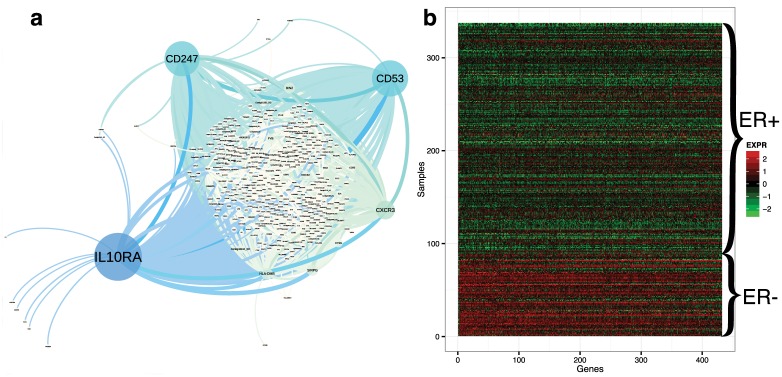
Fig 4. Differential ER-status gene co-expression network and gene expression for ER differential genes.
Panel a: differential ER gene co-expression network, where node size corresponds to betweenness centrality, which quantifies the number of shortest paths between all pairs of nodes in the network in which the gene is included. Panel b: gene expression levels for 432 genes in the ER-status differential co-expression network.

