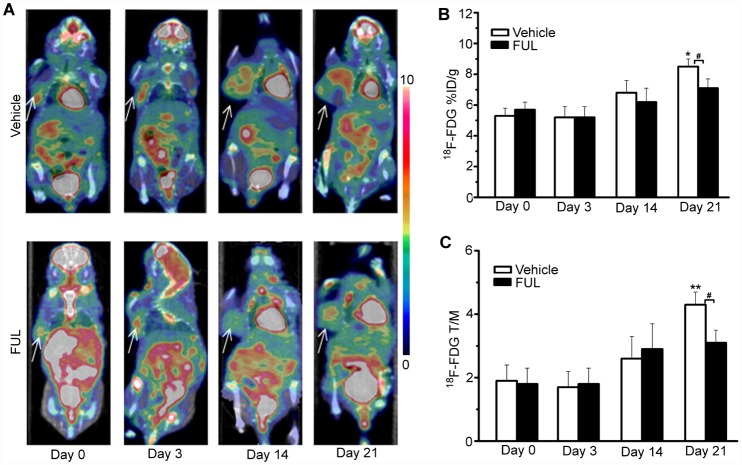
Fig 3. 18F-FDG PET/CT imaging of ZR-75-1 tumor-bearing mice.
(A) Representative ZR-75-1 tumors were imaged using PET/CT with 18F-FDG on days 0, 3, 14, and 21 after treatment. The tumors are indicated by arrows. (B, C) 18F-FDG PET/CT analysis (%ID/gmax and T/M) on days 0, 3, 14, and 21 after treatment. * P< 0.05, ** P< 0.001, within groups compared to baseline; # P< 0.05 between treatment and vehicle groups.

