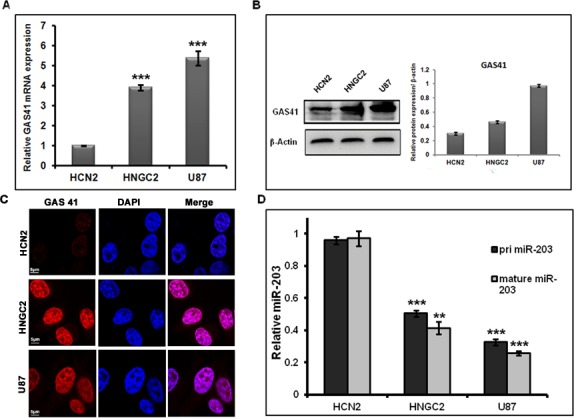
Fig 1. Inverse correlation between GAS41 and miR-203.

(A) Real-time PCR analysis of GAS41 mRNA expression in HNGC2 and U87 glioblastoma cell line compared to normal cell. Bars represent relative GAS41 mRNA level normalized to GAPDH RNA from same sample. (B) Western blot analysis demonstrating GAS41 protein expression in HNGC2, U87 and normal HCN2 cell line. Bars represent mean average of relative GAS41 protein expression normalized to β-actin loading control from three independent experiments. (C) Immuno localization studies of GAS41 protein in HNGC2, U87 and normal cell lines. Scale bars represent 5μm. (D) RT-PCR studies showing the expression of pri-miR-203 and mature miR-203 in HNGC2, U87 and normal cell line. Bars represent relative pri-miR-203 and mature miR-203 level normalized to U6 RNA in the same sample. ** represents p value <0.01, *** represents p value <0.001 vs normal cell line. All experiment was conducted in triplicates.
