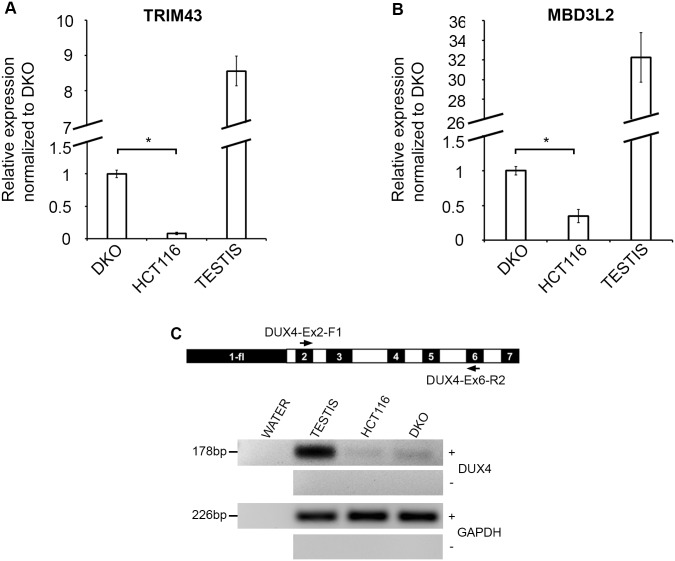
Fig 4. DUX4 target gene expression in HCT116 and DKO.
(A) Results of qRT-PCR for DUX4 target genes TRIM43 in the HCT116, DKO and Testis (X-axis) expressed as fold change relative to expression in DKO (arbitrarily set at 1; Y-axis), normalized with respect to GAPDH expression. All values are obtained by averaging results from triplicates for each sample. Error bars represent standard error (n = 3). Statistical significance is indicated (* p = < 0.001). (B) Results of qRT-PCR for DUX4 target genes MBD3L2 in the HCT116, DKO and Testis (X-axis) expressed as fold change relative to expression in DKO (arbitrarily set at 1; Y-axis), normalized with respect to GAPDH expression. All values are obtained by averaging results from triplicates for each sample. Error bars represent standard error (n = 3). Statistical significance is indicated (* p = < 0.05). (C) Primer map and representative image of ethidium bromide–stained agarose gels showing RT-PCR results showing expression of non-pathogenic polyadenylated mRNA transcripts. Cell lines indicated on top treated with (+) and without (-) reverse transcriptase along with water control and testis as a positive control. Expected product sizes are indicated on the left. A GAPDH amplification positive control for all samples is shown at the bottom.

