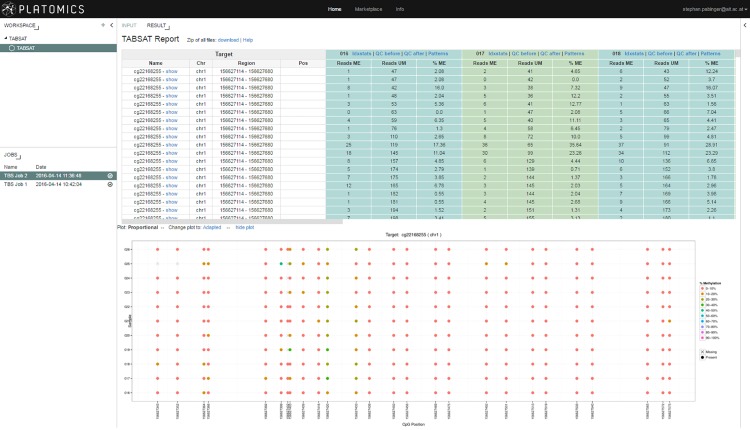
Fig 3. The result of a TABSAT run using the Platomics platform is shown.
The output table of a run is presented in the upper part of the large panel containing the sequencing results for each CpG site of all samples. The lower panel shows the graphical representation of the methylation results. Additional information, such as mapping statistics and quality control information, about each sample can be accessed by clicking on the corresponding links.

