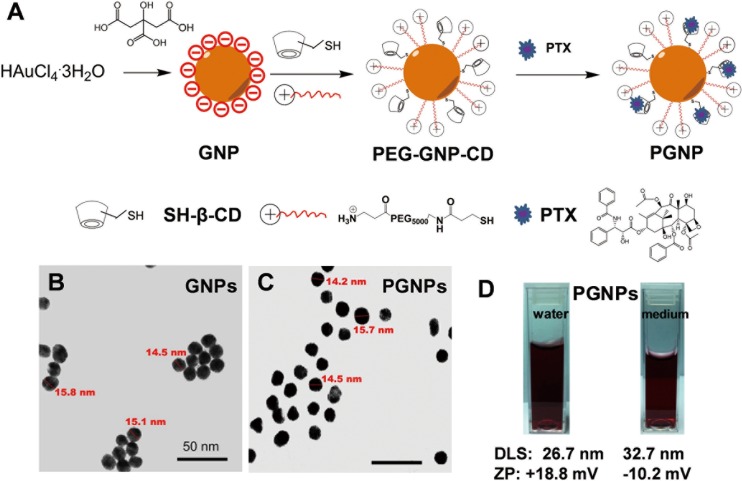
Fig 1. Preparation and characterization of PGNPs.
(A) Preparation of PGNPs. (B, C) TEM images of GNPs and PGNPs. The scale bars are 50 nm. (D) Photographs showing that the PGNPs were well dispersed in water and in cell culture medium with 10% of FBS. The nanoparticles’ hydrodynamic size and zeta potential (ZP) are also shown.

