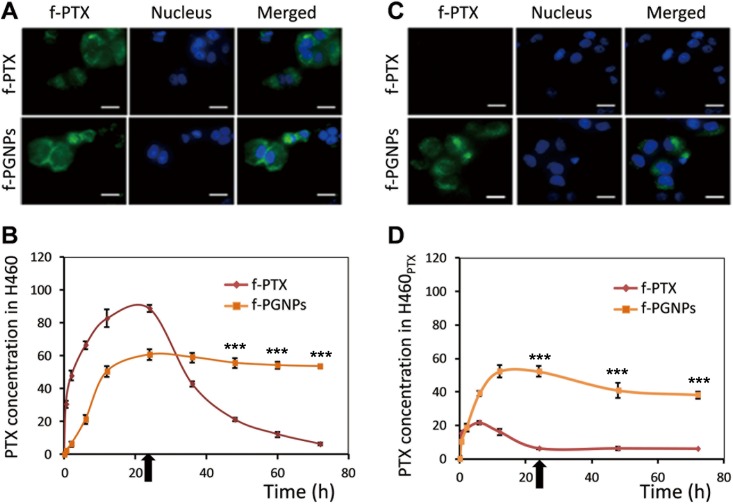
Fig 7. Cellular drug accumulation of f-PTX and f-PGNPs.
Fluorescence images of (A) drug-sensitive H460 cells and (C) drug-resistant H460PTX cells treated with f-PTX and f-PGNPs. H460 and H460PTX cells were treated with free f-PTX (50 nM) or f-PGNP (the total concentration of f-PTX was 50 nM) for 24 hrs and the photos were captured by fluorescent microscopy. The scale bars are 10 μm. The figure is the representive of results from three independent expeiments. Intracellular accumulation of f-PTX in (B) drug-sensitive H460 cells and (D) drug-resistant H460PTX cells treated with f-PTX or f-PGNPs for different times, as measured by flow cytometry. Black arrows indicate removal of free f-PTX and f-PGNPs at 24 hrs of incubation. Each data point was measured in triplicate. Data are mean±s.d. ***P<0.001 compared with that treated with f-PTX for the same time period.

