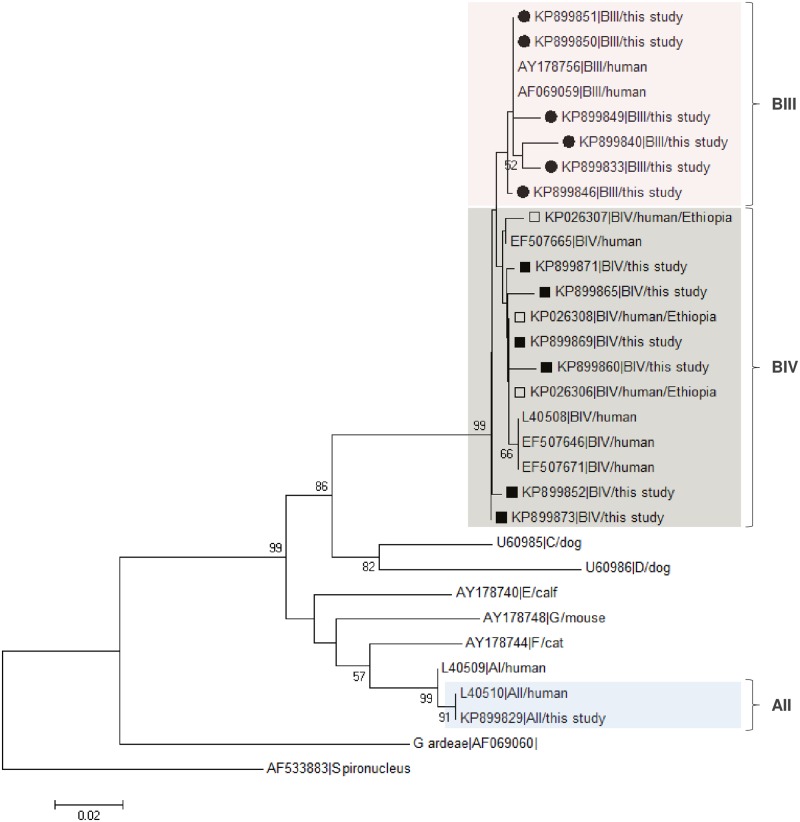
Fig 3. Evolutionary relationships among assemblages of G. duodenalis at the GDH locus inferred by a Neighbor-Joining analysis of the nucleotide sequence covering a 403-bp region (positions 80 to 467 of GenBank accession number L40508) of the gene.
The percentage of replicate trees in which the associated taxa clustered together in the bootstrap test (1,000 iterations) is indicated next to the branches. Bootstrap values lower than 50% were not displayed. The evolutionary distances were computed using the Kimura 2-parameter method. The rate variation among sites was modelled with a gamma distribution (shape parameter = 2). Filled circles and squares represent BIII and BIV sequences, respectively, from this study. Open squares indicate BIV sequences previously reported in human isolates from Ethiopia [see ref. 22]. Spironucleus vortens was used as outgroup taxa.

