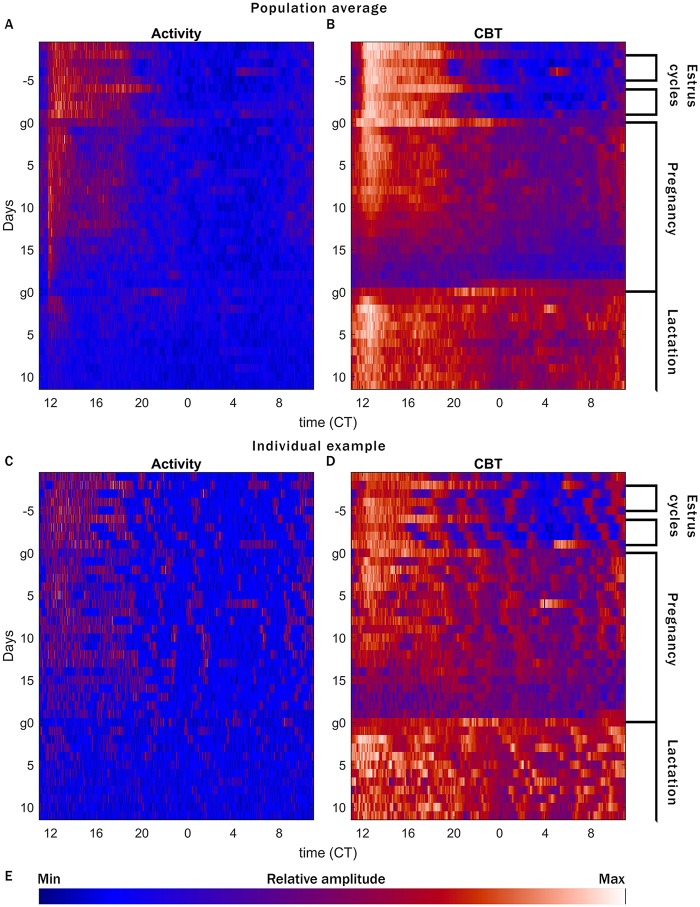
Fig 1. Comparison of CBT and LA data.
CBT and LA both reveal changes in female reproduction, but CBT contains more information, especially during times of low LA. Raster plots of relative LA (A, C) or CBT (B, D) counts per minute (color map in E), arranged by ZT (12 = lights off: light:dark bars at the top of each plot indicate the light cycle), with sequential days stacked from top to bottom. Median of 12 mice (A, B) and an individual example mouse (C, D). Patterns matching expectations for estrus—prolonged peak of CBT every 4 days—are apparent in the top 9 rows, more easily detected in CBT than LA. Mice are paired for a single 17 h window encompassing the dark phase of day g0. Birth times are confirmed by twice-daily inspections following g18, and occur on the same day in all pregnancies. After birth, pups remain with the dam until weaning (not shown). Bright spots every 7 days (D) reflect cage changes. Color map (E) shows relative amplitude of LA and CBT. N.B. the strong ~3h UR in the individual CBT plot (D), which is largely washed out in the median (B).

