
Figure 2. CT-based preoperative nomogram for predicting overall survival.
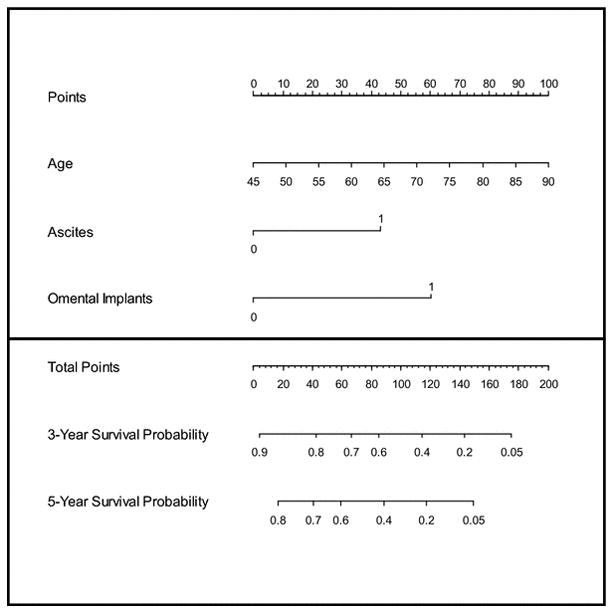
For each patient, find out the value of each predictor and read off the number from “Points” located on the top axis, then add the points of all predictors and locate it on the “Total Points” axis. The 3-year and the 5-year survival probabilities are the values intersected by a line drawn vertically from the total points.