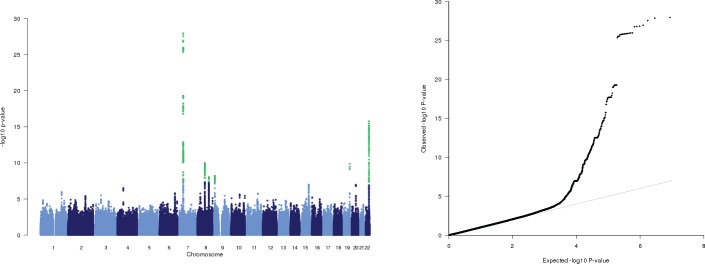
Fig 1. Results of the Genome-Wide Meta-Analysis in Dupuytren’s Disease.
P-values were obtained under an additive genetic model with adjustment for minor population stratification. Effect sizes were synthesized using a fixed-effects regression model, thereby hypothesizing that the studies differed only in their statistical power to detect the outcome of interest. Both Cochran’s Q statistic and I2 index were used to evaluate statistical heterogeneity between studies. (A) Quantile-quantile (QQ) plot of observed phenotypic association p-values. The grey line represents concurrence of the expected and the observed p-values under a true null hypothesis of no association. Values above the line indicate a signal in the data. (B) Manhattan plot showing the p-values (−log10) plotted against their respective positions on each chromosome with each dot representing a SNP. Green dots represent SNPs that surpass the genome-wide significance threshold of 5×10⁻⁸. Manhattan and QQ plots were generated based on those 4,350,741 SNPs included in the meta-analysis that did not show indication of heterogeneity between studies.

