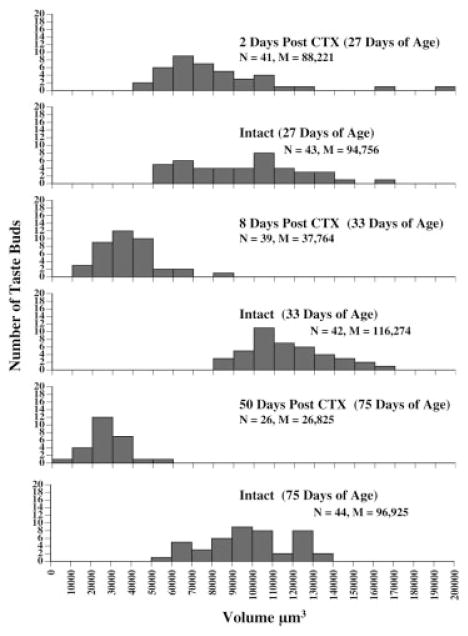
Figure 5.
Histograms representing volume measurements of taste buds at 2, 8, or 50 days after CTX at 25 days of age. The age of the animals at the time of sacrifice is presented in parentheses. Denervated (CTX) and intact sides of the tongue are presented as separate graphs at each time point. Histological analysis of a total of 4 mm of tongue tissue (2 rats per group, 2 mm tissue per rat) is shown along with the total number (N) of taste buds and the average (M) taste bud volume per group.

