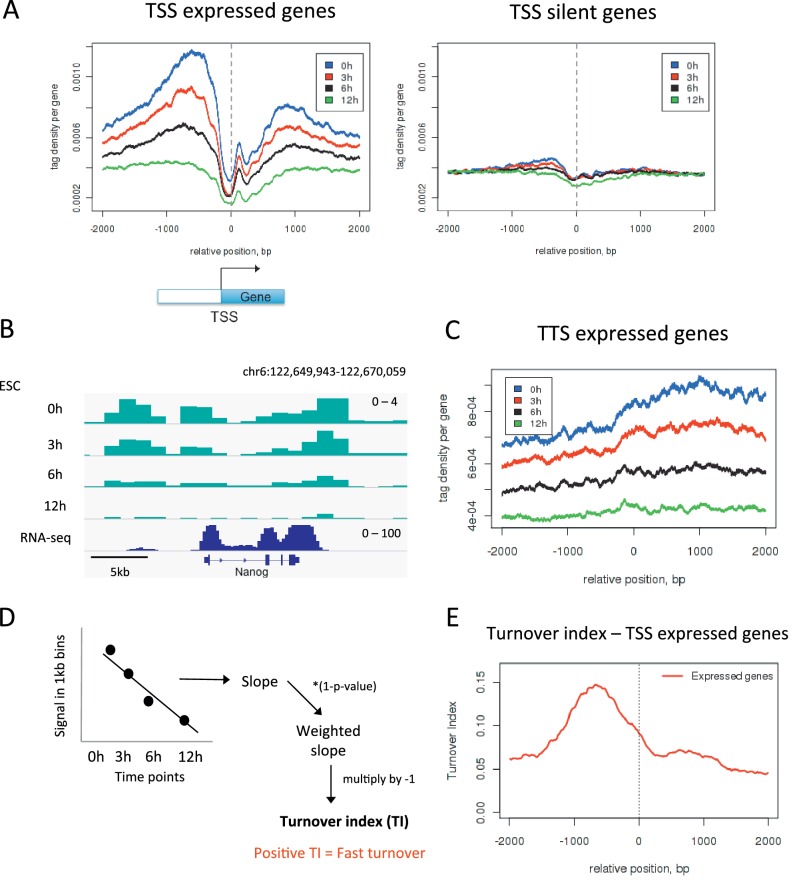
Figure 2. Measuring H3.3 turnover in ESCs.
(A) Average H3.3 profiles for 0 hr, 3 hr, 6 hr and 12 hr time points over the transcription start sites (TSSs) of expressed and silent genes in ESCs. (B) H3.3 in 1kb bins profiles for 0 hr, 3 hr, 6 hr and 12 hr time points at the actively transcribed Nanog locus. (C) Average H3.3 profiles over the transcription termination sites (TTSs) of genes expressed in ESCs. (D) Calculating turnover index (TI) in 1 kb bins across the genome. H3.3 signal for each bin was plotted for every time point, these were fitted to a linear regression model and the slope of this line was weighted and multiplied by minus 1 to get TI. (E) Average TI over the TSSs of expressed genes. For (A–C) results from one experiment representative of three biological replicates is shown.


