
Figure 3. Regions with high TI in ESCs have regulatory functions.
(A) Representation of annotated genomic features in the 1000 highest TI regions in ESCs relative to their representation in the genome as a whole. Overrepresentation was calculated by taking the log2 ratio of the proportion of the high TI regions overlapping a particular feature divided by the proportion of whole genome overlapping the same feature. (B) The region 5’ of the Fgf18 gene and 3’ of the neighboring Npm1 gene has high TI in ESCs. Signal for each time point is shown for one replicate (top 4 tracks – green) while TI averaged for 3 replicates is shown (heatmap). RNA-seq in ESCs is shown in blue while the highest TI regions are marked with red bars. (C) Super-enhancers in the NR_037986 locus are amongst the most highly turned over regions in ESCs. Super-enhancer constituents are as defined by (Whyte et al., 2013) and shown as blue bars. (D) Unannotated regions are also present in the set of highest TI regions. The red bar marks a high TI region downstream of the Gulp1 gene on chr1. (E) ESC TI distribution at annotated genomic elements – promoters, 5’ end of genes, gene bodies, TTSs and enhancers. Genes are grouped by ESC expression level and ESC enhancers are from Whyte et al. (2013). (F) Average TI over conventional ESC enhancers (purple) and super-enhancer constituent enhancers (pink) as described in Whyte et al. (2013).
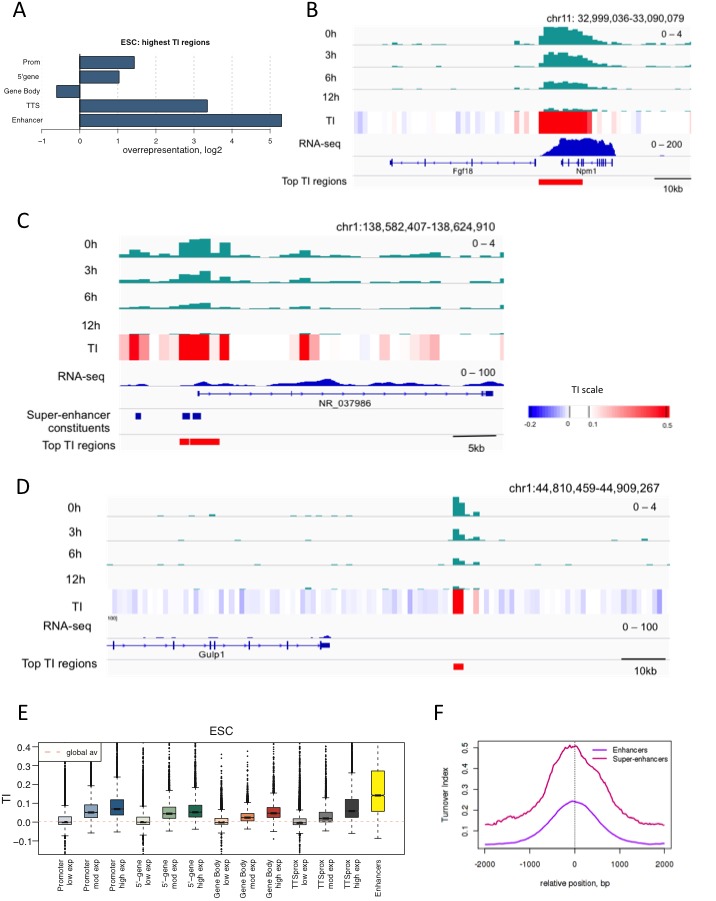
Figure 3—figure supplement 1. H3.3 turnover at enhancers and super-enhancers calculated using a 300 bp bin size.
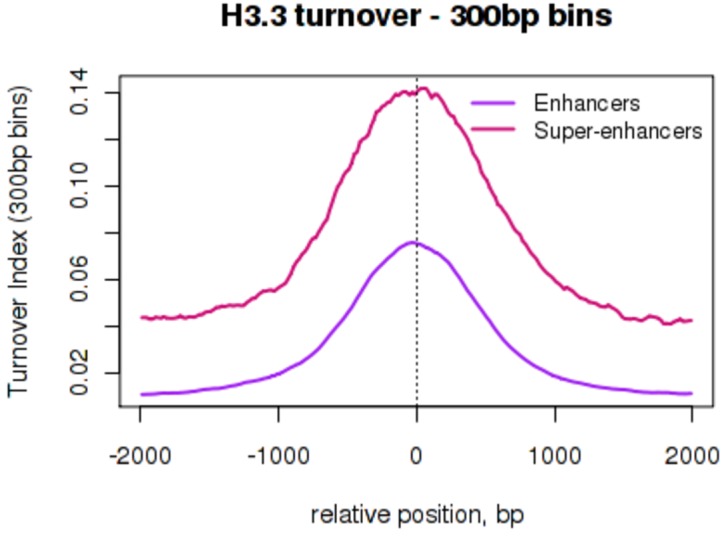
Figure 3—figure supplement 2. H3.1 turnover at ESC enhancers and super-enhancers.
