
Figure 4. H3.3 turnover at PcG targets in ESCs.
(A) TI averaged over PcG-bound genomic regions (turquoise) and all CpG islands (red). (B) TI averaged over the TSSs of active genes (red), PcG targets (turquoise) and silent genes (blue) in ESCs. (C) The PcG-regulated Hoxb locus shows enrichment for H3.3 (top 4 tracks show H3.3 at each time point) but low TI (heatmap). The grey tracks show ChIP-seq for PcG protein Ring1b and the blue tracks RNA-seq. (D) The non-PcG-bound active gene Hnrnpa3 shows greater H3.3 enrichment and higher TI than Hoxb. TI scale is the same as in Figure 3.

Figure 4—figure supplement 1. H3.3 enrichment at PcG targets in ESCs.
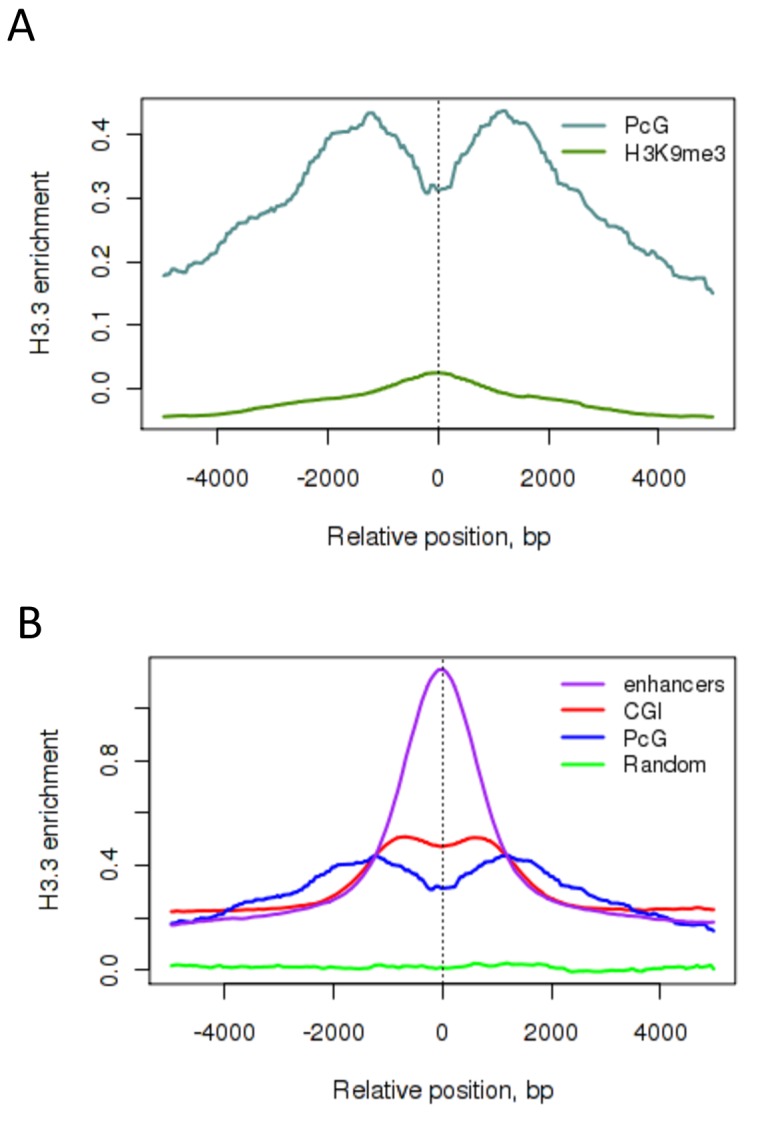
(A) H3.3 enrichment in ESCs at PcG targets (grey) compared to H3K9me3 regions (green). (B) H3.3 enrichment in ESCs at PcG targets (blue), CpG islands (CGI – red), enhancers (purple) and randomized PcG regions (green).