
Figure 5. H3.3 turnover and distribution changes during neural differentiation of ESCs.
(A) Average TI profile around TSSs of genes that lose PcG binding and increase gene expression upon differentiation to NSCs. (B) The region containing the Olig1 and Olig2 genes, which are activated during neural differentiation, shows a dramatic increase in H3.3 turnover when ESCs are differentiated to NSCs. The top tracks represent H3.3 (green) and TI (heatmap) in ESCs while the bottom tracks show H3.3 (purple) and TI in NSCs. The grey tracks show ChIP-seq for PcG protein Ring1b and the blue tracks RNA-seq. (C) Average H3.3 enrichment (0 hr sample) over PcG-bound regions in ESCs and NSCs. (D) Hoxb remains bound by PcG (Ring1b) in NSCs but H3.3 enrichment is lost. (E) Average TI at ESC-specific enhancers in ESCs (cyan) and NSCs (purple). (F) NSC TI distribution at annotated genomic elements – promoters, 5’ end of genes, gene bodies, TTSs and enhancers. Genes are grouped by NSC expression level and putative NS enhancers were defined using H3K27ac ChIP-seq data from Encode (E14.5 embryonic brain - ENCFF001XZR). (G) Representation of annotated genomic features in the 1000 highest TI regions in NSCs relative to their representation in the genome as a whole.
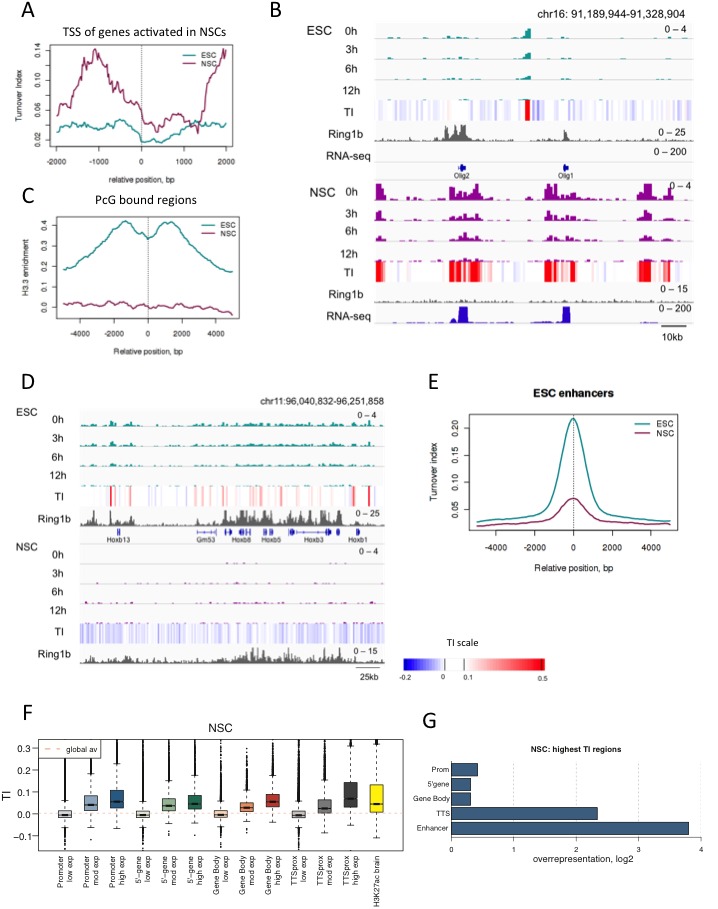
Figure 5—figure supplement 1. Generation of H3.3_SNAP NSCs.

Figure 5—figure supplement 2. Measuring turnover in H3.3_SNAP NSCs.
