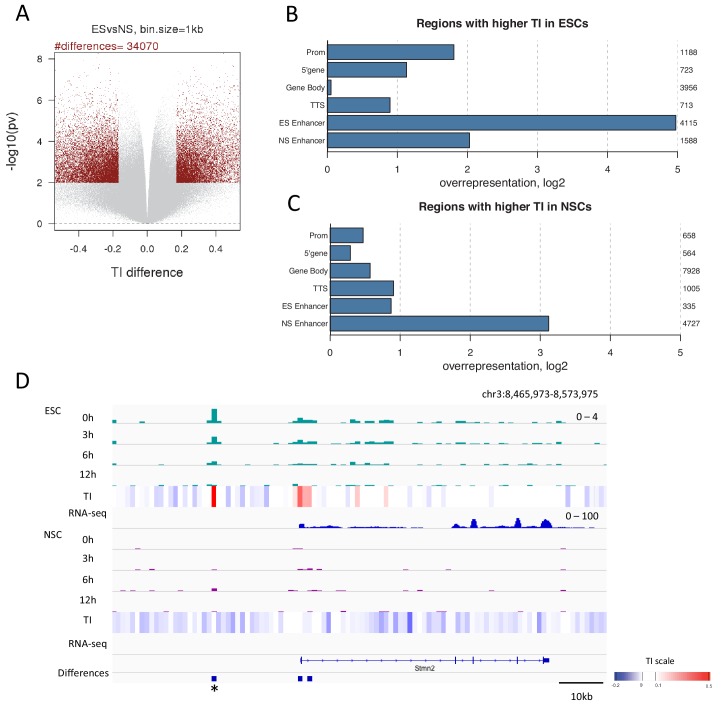
Figure 6. Changes in TI occurring during neural differentiation often occur at enhancers.
(A) Volcano plot showing differences in TI between ESCs and NSCs. Regions with a TI difference in the top 2.5% with a p-value≤0.01 were selected as changing during differentiation (red dots). (B) Representation of annotated genomic features in regions showing higher TI in ESCs compared to NSCs (selected as described in A). The numbers to the right of the plot indicate the number of regions corresponding to each type of genomic feature. (C) Representation of annotated genomic features in regions showing higher TI in NSCs compared to ESCs (selected as described in A). (D) An unnanotated region on chromosome 3, which shows an increase in H3.3 and TI upon differentiation of ESCs to NSCs (asterisk) and an expression decrease in the nearby Stmn2 gene. The heatmap shows average TI while differences in TI are represented by blue bars.

