
Figure 7. H3.3 turnover correlates with DNA accessibility at enhancers.
(A) Boxplot of average ESC TI and MACC at ESC enhancers, the TSSs of expressed genes, and PcG-bound regions. (B) Pearson’s correlation between DNA accessibility as measured by MNase titration (MACC) and TI at ESC enhancers. For MACC four replicates are shown for each cell type, two for ESC_ and NSC_H3.3_SNAP lines ('a' replicates) and two for separate ESC and NSC lines ('b' replicates). For TI three biological replicates are shown. (C) Boxplot of average TI and MACC values at ESC enhancers. (D) The Oct4/Pou5f1 super-enhancer shows high MACC (green) and TI (heatmap) in ESCs but not in NSCs.

Figure 7—figure supplement 1. Measuring DNA accessibility using MNase titration.

(A) Boxplot of average TI over DNase hypersensitive regions in E14 ESCs (Encode accession ENCSR000CMW). TI index was plotted over called DNase peaks (E14-DS18505.peaks.fdr0.01). (B) MNase digestion patterns generated by digestion of ESC and NSC chromatin with varying concentrations of enzyme (1U, 4U, 16U, 64U). (C) Sequencing data from each of the above titration points was used to generate an accessibility score (MACC) by fitting these to a linear model.
Figure 7—figure supplement 2. Comparing turnover to DNA accessibility measured by MNase titration.
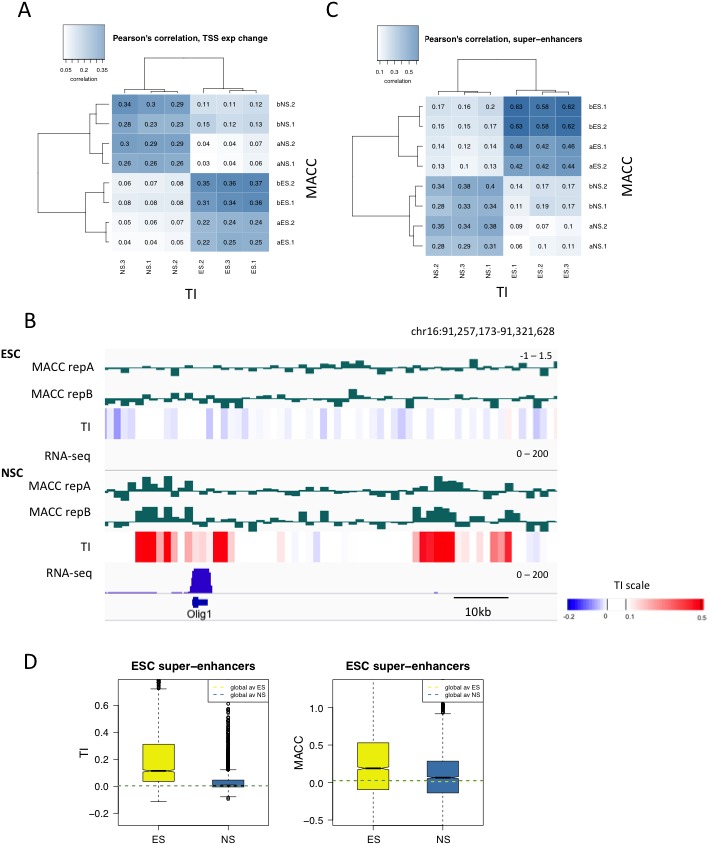
(A) Pearson’s correlation between DNA accessibility as measured by MNase titration (MACC) and TI at the TSSs of genes differentially expressed in ESCs and NSCs. For MACC four replicates are shown for each cell type, two for ESC_ and NSC_H3.3_SNAP lines ('a' replicates) and two for separate ESC and NSC lines ('b' replicates). Three biological replicates are shown for TI. (B) Olig1 is activated during neural differentiation and shows high MACC (green) and TI (heatmap) in NSCs but not ESCs. RNA-seq is shown in blue. (C) Pearson’s correlation between DNA accessibility as measured by MNase titration (MACC) and TI at ESC super-enhancers. Details as described in C. (D) Boxplot of average TI and MACC values at ESC super-enhancers.