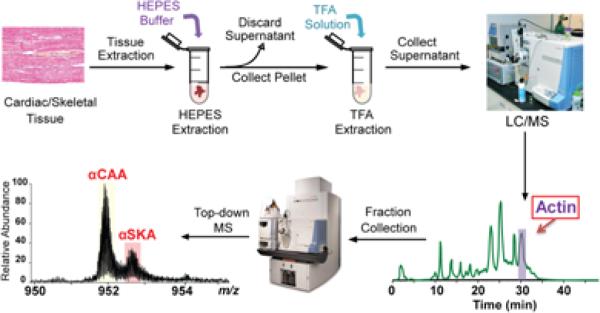
Figure 1. Schematic representation of the integrated top-down LC/MS+-based method for quantification of α-actin isoforms.
Tissues are homogenized in HEPES buffer; the myofilament proteins are extracted by 1% TFA buffer and separated using LC/MS. The α-actin fraction is then collected and analyzed using a high-resolution mass spectrometer.

