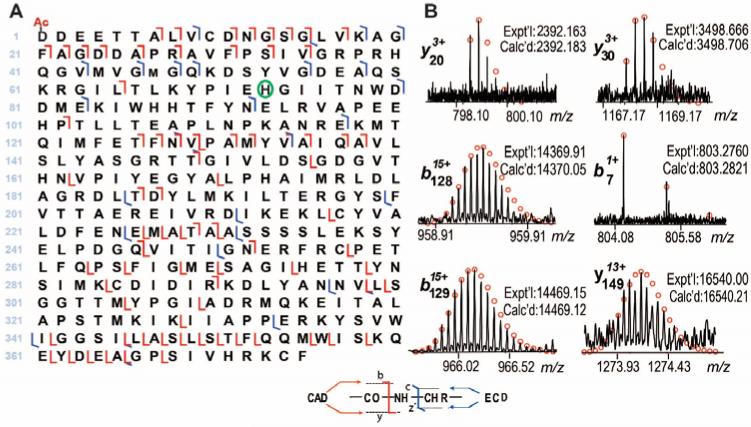
Figure 3. Comprehensive characterization of α-cardiac actin (αCAA) by top-down high-resolution MS.
(A) The fragmentation map of αCAA based on ECD and CAD spectra, Ac-represents acetylation, and the green circle represents methylation. (B) The representative b and y ions from CAD experiments. Fragmentation assignments were made based on the sequence of human αCAA (P68032, ACTC_HUMAN, UniProtKB/Swiss-Prot) with acetylation at the N-terminus and methylation at His73. Circles represent the theoretical isotopic abundance distribution of the isotopomer peaks corresponding to the assigned mass. Calc'd, calculated molecular weight; Expt'l, experimental molecular weight.

