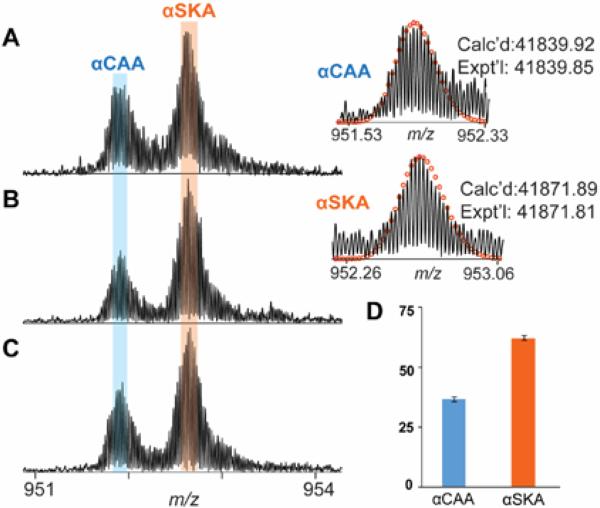
Figure 5. High-resolution MS for quantitative analysis of α-actin isoforms in swine hearts.
A-C) Representative spectrum of α-actin isolated from three different biological samples. D) The bar graph represents the ratio of αCAA and αSKA in pig hearts. Circles represent the theoretical isotopic abundance distribution of the isotopomer peaks corresponding to the assigned mass. Calc'd, calculated most abundant molecular weight; Expt'l, experimental most abundant molecular weight.

