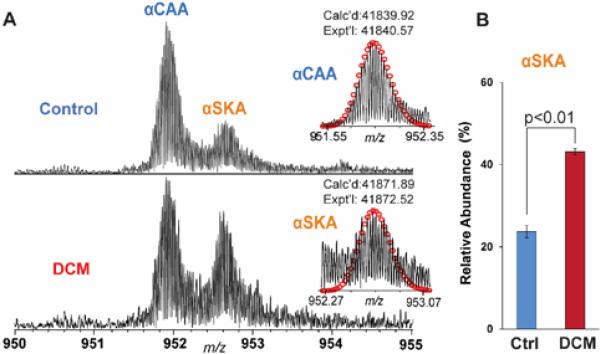
Figure 6. Quantification of the relative abundance of αSKA from control and DCM human hearts.
A) Representative high-resolution MS spectra of human α-actin purified from healthy human heart (top) and end-stage failing human heart with DCM (bottom). Calc'd, calculated molecular weight; Expt'l, experimental molecular weight. B) The bar graph represents αSKA ratio to total α-actin. All measurements were performed with three biological replicates per group. The data are represented as the mean peak area ± S.E.M. Ctrl, control.

