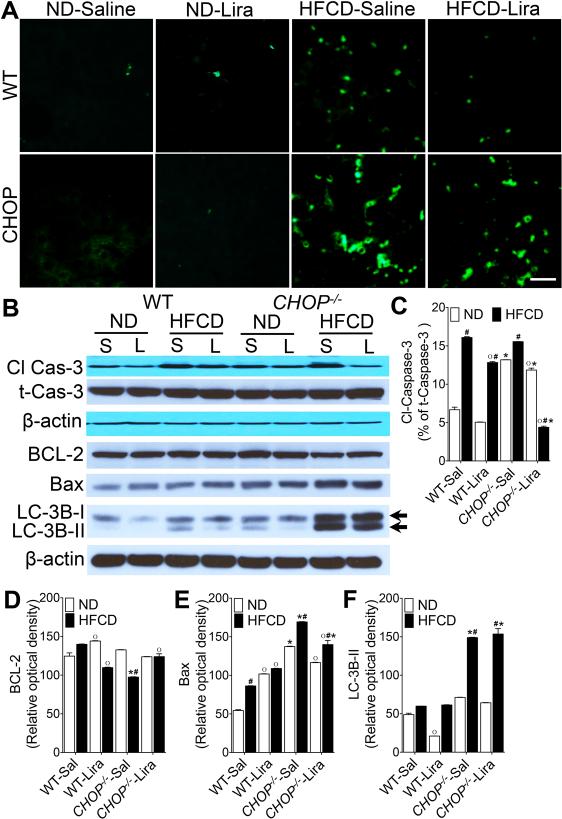
Figure 7. Liraglutide treatment suppresses apoptosis in HFCD-fed WT mice but not in CHOP−/− mice.
(A) Representative immunofluorescence images of liver tissue sections stained with terminal deoxynucleotidyl transferase (TUNEL; green) to detect apoptotic cells. (B) Representative western blot images and (C-F) densitometry measurements of hepatic cleaved caspase 3, BCL-2, Bax and LC-3B expressions in WT and CHOP−/− mice fed a ND or HFCD for 16 weeks. After 12 weeks of feeding, mice received daily injections of saline (sal) or Liraglutide (Lira) for 4 weeks. Data are presented as mean ± SEM; n = 5-7 mice per group. Hashtags indicate significant differences (p < 0.05) between ND- or HFCD-fed mice. Stars indicate significant differences (p < 0.05) between WT and CHOP−/− mice. “o” indicate significant differences (p < 0.05) between saline or Liraglutide treated mice. Scale 20 μm.

