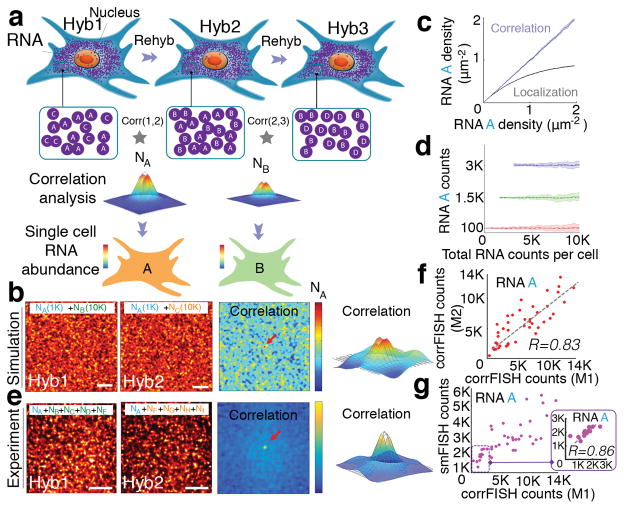
Figure 1.
Correlation FISH. (a) Schematic of sequential hybridizations and barcoding of dense mRNA molecules in a cell. Correlation analysis of any two subsets of hybridization images reveals the amount of common RNA molecules. Hyb 1 and Hyb 2 images share the RNA A in the presence of other uncorrelated RNA B and C in each channel. Pair-wise correlations across Hybs (1,2) and (2,3) peak values are estimators of the copy number of RNA A (NA) and B (NB), respectively in that cell (b, c). (d) Simulated images of a 30 μm cell with 1000 molecule A in the presence of 10,000 molecule B or molecule C in hybridizations 1 and 2. Correlation of these images provided a peak value (denoted by the red arrow and 3D plot) that corresponds to the copy number of A. (e) Simulated RNA molecules are measured using both correlation and spatial localization. Correlation accurately estimates RNA levels even at high density of RNAs. (f) Detection accuracy analysis with 100, 1500, 3000 copies of A in the presence of increasing concentrations of B and C in simulated data. RNA A levels were kept constant while increasing RNA B and C density (n=20 simulation runs). Dashed line shows the expected value of A transcripts. Even 100 molecules can be accurately detected out of a total of 10,000 molecules at a density of 10 molecule μm−2. (g) Experimental images of a 20 μm cellular regions with A gene (NA) in the presence of other 4 uncorrelated genes (NB, NC, ND, and NE) and (NF, NG, NH, and NI) in hybridizations 1 and 2, respectively. Corresponding correlation functions yield transcript abundance of gene A. Scale bars are 5 μm. (h) Transcript detection of A gene in five gene experiments using two different correlation FISH barcodes (M1: H1*H2 and M2: H2*Rps2 from H3) with a linear fit of R = 0.83 and P<0.002 (Student’s t-test) for n=43 cells. (i) Comparison of transcript counting of A molecules based on single molecular FISH counting and correlation FISH quantification. Inset shows a correlation with R= 0.86 and P<0.0006 (Student’s t-test) in the linear regime, between 0–3,000 transcripts, where smFISH quantification is not saturated.

