Figure 2.
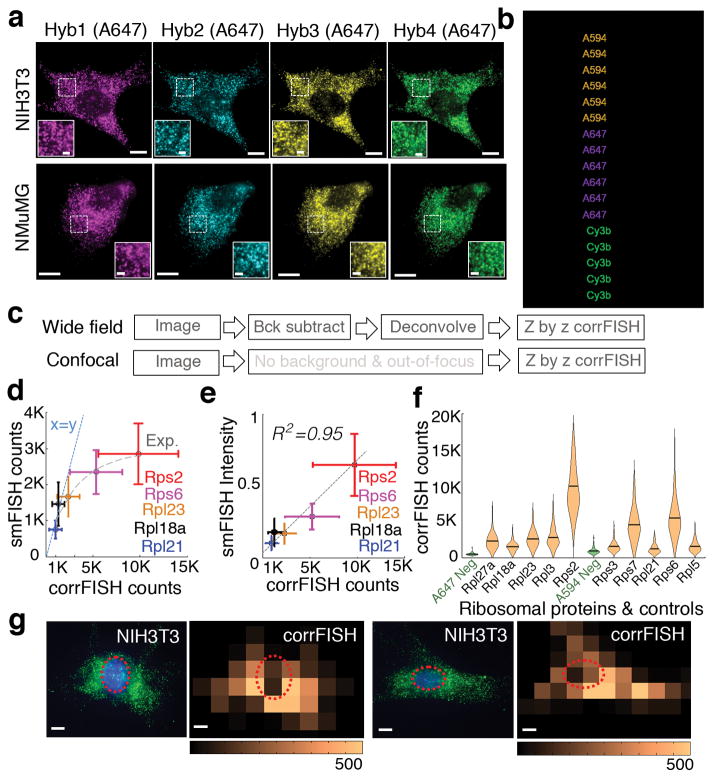
corrFISH works accurately in cell cultures. (a) Images of ribosomal protein transcripts in NIH3T3 cells across four hybridizations in NIH3T3 and NMuMG cell types. Scale bars 10 μm and 2 μm (insets). (b) Barcode scheme for ten genes using two fluorophores and four rounds of hybridization. 1 corresponds to the probes with Alexa 594 dyes, 2 corresponds to probes labeled with Alexa 647. Additional color 3 corresponds to cy3b labeled probes that were used to perform one gene at a time as a control experiment for single molecule localization based counting. (c) Experimental images generated using a workflow of corrFISH processing for either wide field or confocal microscope. (d) Experimental characterization of dynamic range based on the comparison of single molecule FISH counting and corrFISH quantification. Five ribosomal protein genes, covering Rpl21, Rpl18a, Rpl23, Rps6, and Rps2, were plotted for smFISH counting versus corrFISH quantitation. smFISH significantly underestimates the transcripts at higher densities due to the overlapping FISH spots. At the highest copy numbers, 5000 smFISH counts corresponded to the 15000 corrFISH counts. A linear x=y line (dashed blue) and an exponential fit (grey dash) are shown for comparison. (e) Comparison of the summed intensity of single molecule FISH dots and correlation FISH quantification, agreeing well with each other (R2 = 0.95) for n=85 cells. (f) Single cell RNA distributions of 10 ribosomal protein genes with negative controls. The negative control (green), which is empty barcode, is detected at 0.08 molecule μm−2. This corresponds to the sensitivity limit, of 222 ±18 s.e. mRNAs per cell for 2,674 μm2 cellular area. (g) Spatial analysis via corrFISH using subregion analysis. NIH3T3 cell with ribosomal protein transcripts (Rpl3 and Rpl27a in hybridization round 2) in green and nucleus stained by DAPI shown in blue. Correlation based transcript abundance mapping over 25 sub-regions within the cell. Repeat hybridizations, both contain Rpl3 and Rpl27a, are correlated to generate the map. Another fibroblast with original image and the corresponding correlation map. Dashed circle shows the nuclear region in both of the microscopic images and correlation based transcript quantification result. Scale bar 10 μm.

