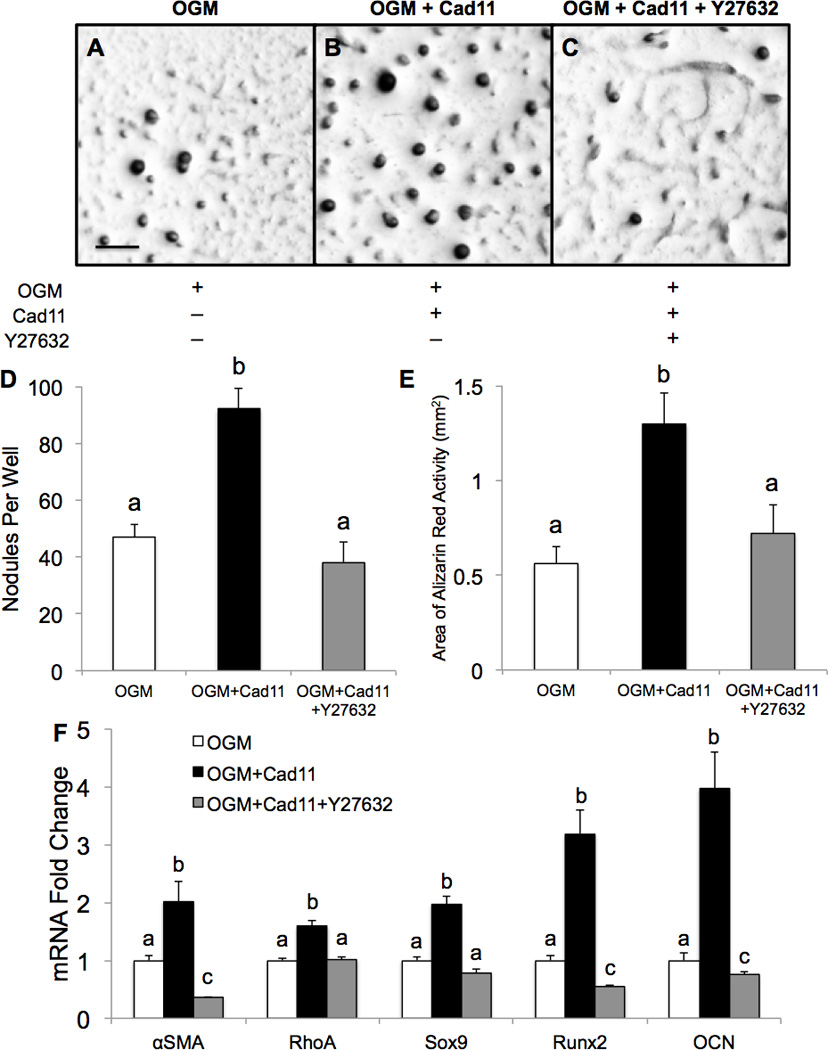
Figure 6. Cad-11 overexpression increases calcification but is attenuated with ROCK inhibition.

A–C, Alizarin Red staining shows calcific nodules of PAVICs placed in osteogenic growth media (OGM) after 10 days. D,E, Quantification of calcific nodules per well and Alizarin Red activity. Scale bar=0.5mm. F, qRT-PCR shows differences in gene expression among PAVICs in the three conditions compared to OGM. Bars that do not share any letters are significantly different according to a one-way ANOVA with Tukey’s post-hoc test (p<0.01, n=4).
