
Figure 7. Calcified human aortic valves display differences in expression between calcified and non-calcified regions and compared to controls.
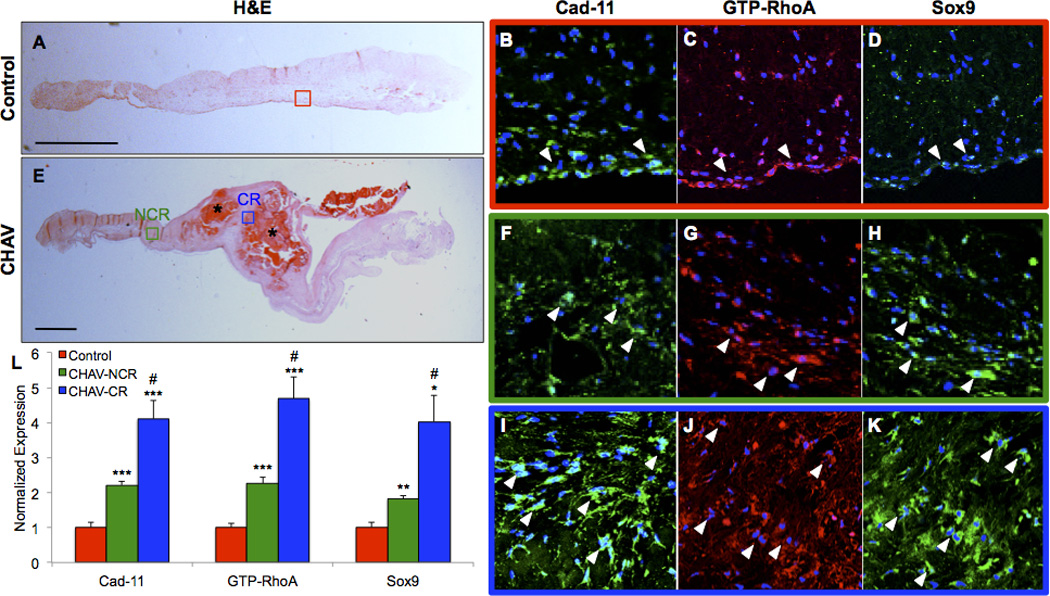
Calcification in control human aortic valves and calcified human aortic valves (CHAV) was visualized with H&E staining (A,E). Cad-11, GTP-RhoA, and Sox9 immunofluorescent staining in control aortic valves (B–D), non-calcified regions (NCR) of CHAV (F–H), and calcified regions (CR) of CHAV (I–K). Quantification of fluorescent intensity (L). White arrowheads point to areas of positive staining. Colored boxes correspond to magnified regions. CR=Calcified Region, NCR=Non-Calcified Region. Significance was determined using the Student’s t-test (n=3 Control, n=5 CHAV, *p<0.05 **p<0.01 ***p<0.005 vs. Control, #p<0.05 vs. CHAV-NCR) Scale bars=1mm