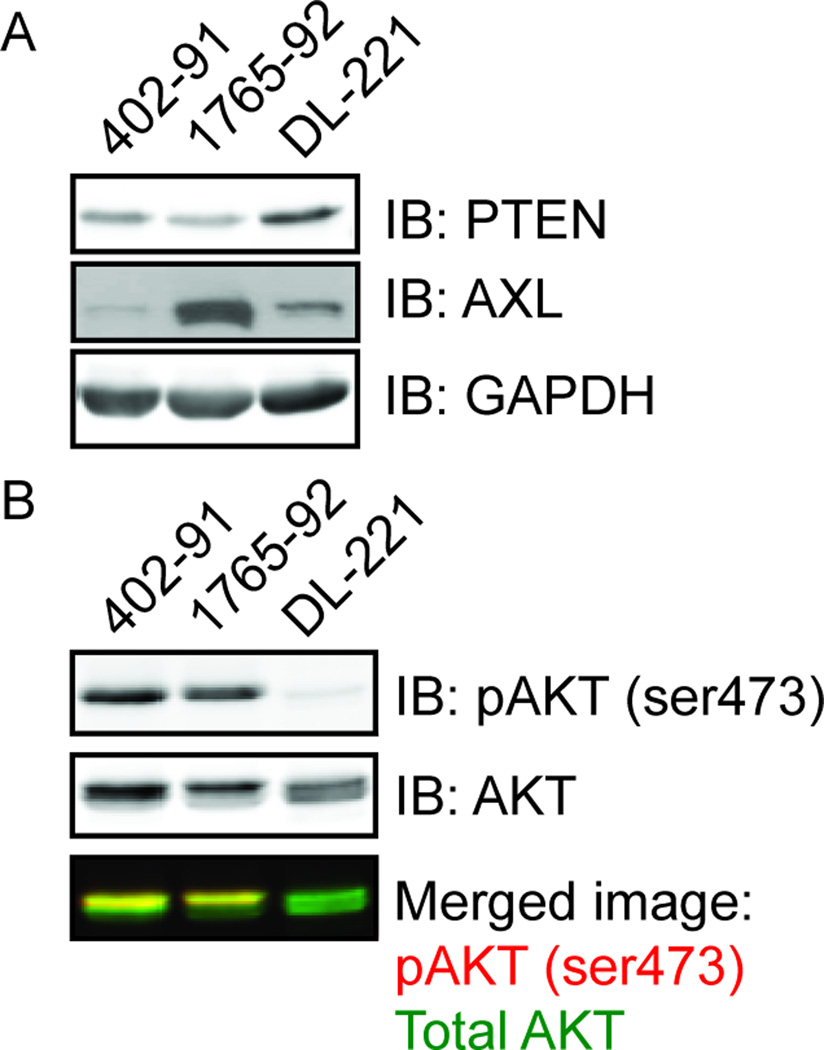
Figure 3. PTEN and pAKT protein expression.
Western blot analysis of (A) PTEN and AXL expression, with GAPDH expression as a loading control, and (B) pAKT (ser473) expression relative to total AKT expression in the myxoid liposarcoma cell lines. The bottom panel shows the merged image of the pAKT (ser473) signal in red and total AKT signal in green. An overlap of both signals produces a yellow band.

