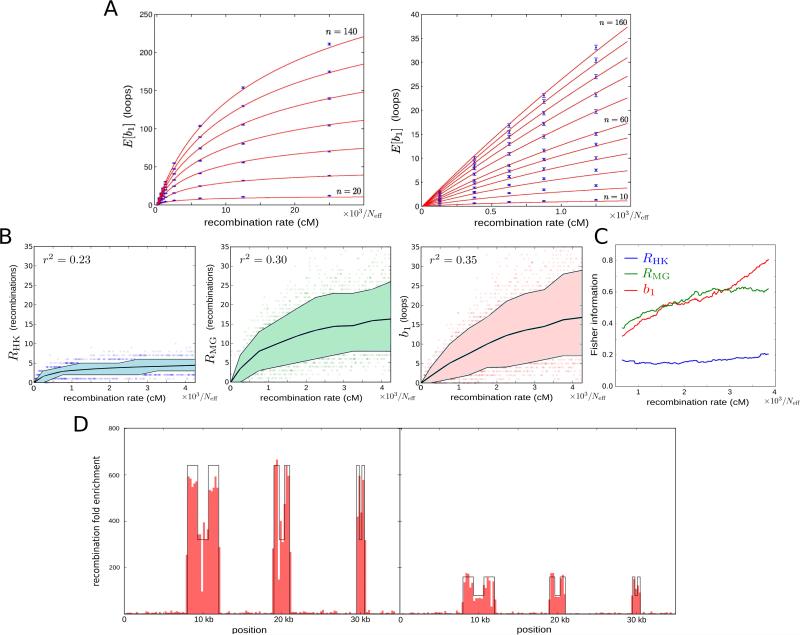
Figure 2. Persistent homology estimator of recombination.
(A) Estimated expected first Betti number E[b1] as a function of the recombination rate (expressed in terms of the effective population size Neff) and sample size n. Each point is based on 500 simulations. Error bars represent 95% confidence level intervals. Red curves correspond to the best fit according to expression (1) in Experimental Procedures.
(B) Dependence of Hudson-Kaplan (left), Myers-Griffiths (center), and b1 (right) summaries of recombination on the recombination rate at fixed number of segregating sites (s = 14). Each plot is based on 4,000 coalescent simulations of a sample of 160 sequences. Colored bands represent the interdecile range and central lines correspond to the mean. Squared Pearson's correlation coefficient is shown in each case.
(C) Fisher information for each of the 3 summaries in (B) as a function of the recombination rate. Information was computed in increments of 12.5/Neff cM. A smoothed trend is plotted by averaging windows of 101 computed values, weighted by the number of simulations.
(D) Distribution of 500 bp segments with ρPH > 0 in simulated samples of 160 sequences, 35 kbp long. The background recombination rate is 500/Neff cM/Mb. Six recombination hotspots of widths 4 kbp, 2 kbp, and 1 kbp are simulated. The local recombination rate is enhanced at hotspots by a factor 640 (left) and 160 (right). Intra-hotpot recombination rate variation is also simulated, with a ½ decay of the local recombination rate at the central region of hotspots.

