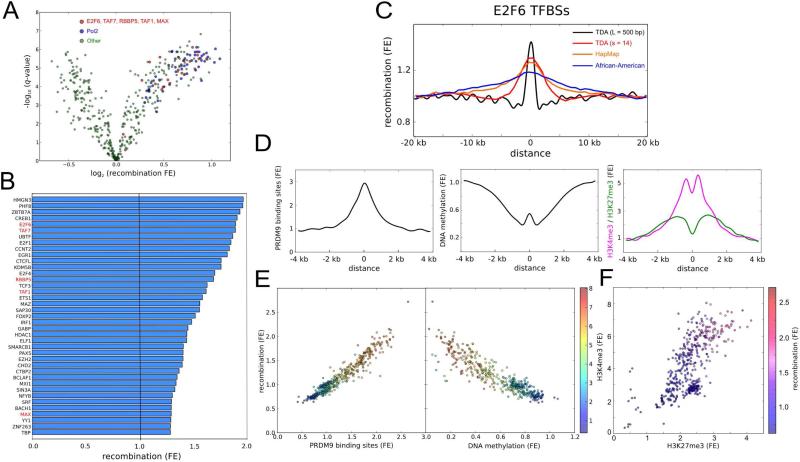
Figure 4. Relation of recombination to TF binding sites.
(A) Recombination enrichments at TF binding sites. Each point corresponds to a different combination of TF and cell line. Binding sites are based on ChIP-seq data from ENCODE (Gerstein et al., 2012). In total 118 TFs and 91 cell lines were considered. Recombination enrichments were computed with respect to neighboring regions using the 500bp recombination map of the British (GBR) population. Statistical significances are adjusted for multiple testing using Benjamini-Hochberg procedure. Pol2 and TFs that may for part of MLL1/2 complexes are indicated in blue and red, respectively.
(B) Recombination enrichment with respect to the whole-genome average for the TF binding sites considered in (A). Only TFs with the highest enrichments are shown. ChIP-seq peaks of each TF were merged across all cell lines. TFs that may for part of MLL1/2 complexes (indicated in red) are generally enriched for recombination.
(C) Recombination enrichment at E2F6 binding sites as a function of the distance to the binding site, according to TDA (L = 500bp and s = 14) recombination maps of the GBR population, as well as Hapmap (International HapMap et al., 2007) and African-American (Hinch et al., 2011) recombination maps. E2F6 binding sites were obtained from ENCODE, merging ChIP-seq peaks across K562 and Hela cell lines.
(D) Enrichment for predicted PRDM9 binding sites (defined by the motif CCNCCNTNNCCNC), and sperm CpG methylation, H3K4me3 and H3K27me3 marks as functions of the distance to E2F6 binding sites, for the binding sites considered in (C).
(E) Recombination enrichment at TF binding sites against enrichment for predicted PRDM9 binding sites (left) and sperm CpG methylation (right), for the TFs and cell lines considered in (A). Color scale represents enrichments for sperm H3K4me3 marks at the loci of these TF binding sites.
(F) Enrichments for sperm H3K4me3 and H3K27me3 marks at the loci of TF binding sites, for the TFs and cell lines considered in (A). Color scale represents recombination enrichment at the loci of these TF binding sites. Higher recombination enrichments occur for bivalent TF binding sites.
See also Figure S3 and Table S3.

