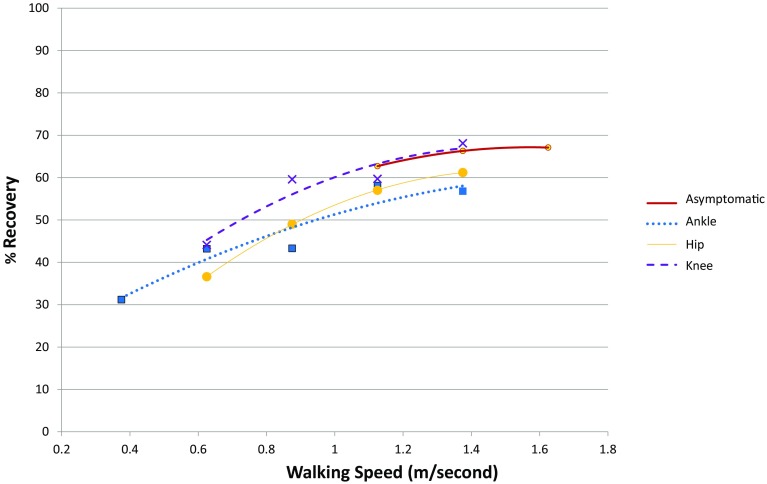
Fig. 4.
The relationship between % recovery and speed (m/second) for individuals with isolated ankle, knee, or hip osteoarthritis (OA) and a cohort of asymptomatic individuals is shown. Points indicate the average recovery for 0.25-ms−1 increments of velocity and the lines indicate the second-order polynomial regression lines for each group to indicate the overall pattern of change with speed increments.

