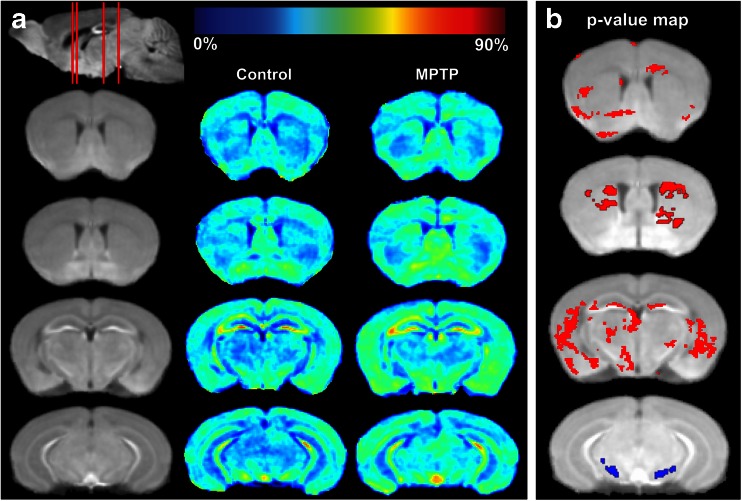
Fig. 1.
Comparison of MEMRI signal enhancement between controls and MPTP-intoxicated mice at day 2 post-MPTP. (A) MEMRI enhancement maps. The first column (from left) shows coronal slices of the averaged MEMRI of control mice (n = 5) as an anatomical reference. The sagittal slice (upper left) shows respective coronal slices (red lines from rostral to caudal) that correspond to images in rows 1–4 showing sections with striatum (rows 1 and 2) or midbrain (rows 3 and 4). The second column shows the average enhancement in control mice on the coronal slices. The third column represents the average enhancement of MPTP-intoxicated mice (n = 6). The color bar for the enhancement maps is at the top of the figure. Dark blue color (0 %) means no change in enhancement from Mn2+ compared with preinjection signal intensity. Dark red color represents 90 % signal increase compared with preinjection signal intensity. (B) Statistical comparison of MEMRI enhancement between control and MPTP-intoxicated mice. Pixels with a significant increase (p < 0.05) in signal intensity are indicated in red, with decreases indicated in blue. Pixel changes are overlaid onto the averaged brain image for visualization

