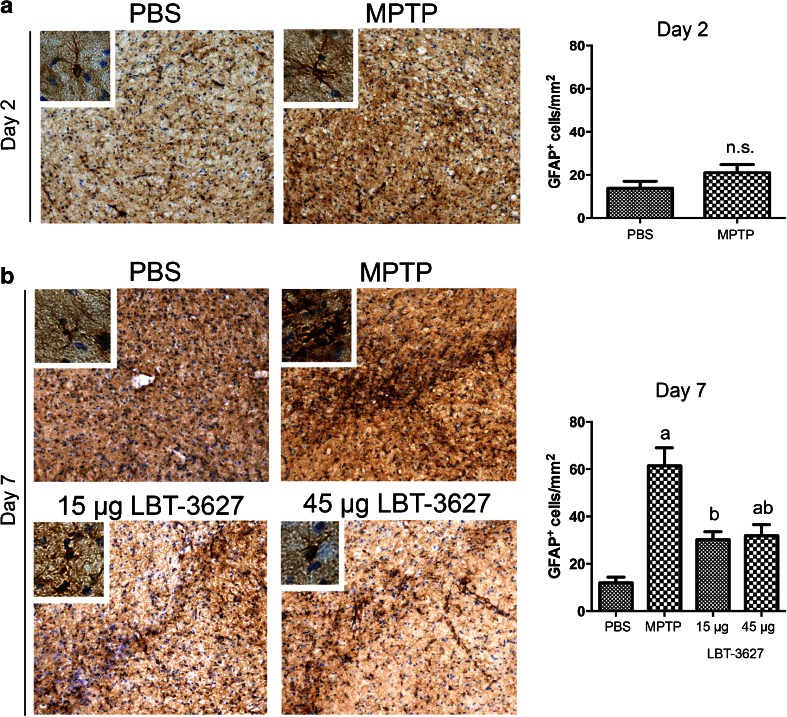
Fig. 5.
Glial fibrillary acidic protein (GFAP) reactivity following MPTP intoxication and LBT-3627 pretreatment. (A) Representative photomicrographs of GFAP immunoreactive cells within the substantia nigra of mice (10× with 40× inset) treated with PBS or MPTP. Quantification of cell number is illustrated in the top right panel. (B) Photomicrographs of GFAP+ cells following MPTP intoxication and LBT-3627 pretreatment at day 7. Quantification of day-7 reactive astrocytes follows. Serial sections were stained with a primary antibody against GFAP, followed by a biotinylated secondary antibody, and diaminobenzidine color development. Sections were counterstained with thionin, and quantification was assessed using stereological analysis. Differences in means (± SEM, n = 5–8) were determined by analysis of variance followed by Fisher’s least significant difference post hoc test where p < 0.05 compared with groups treated with PBS (a) and MPTP (b)

