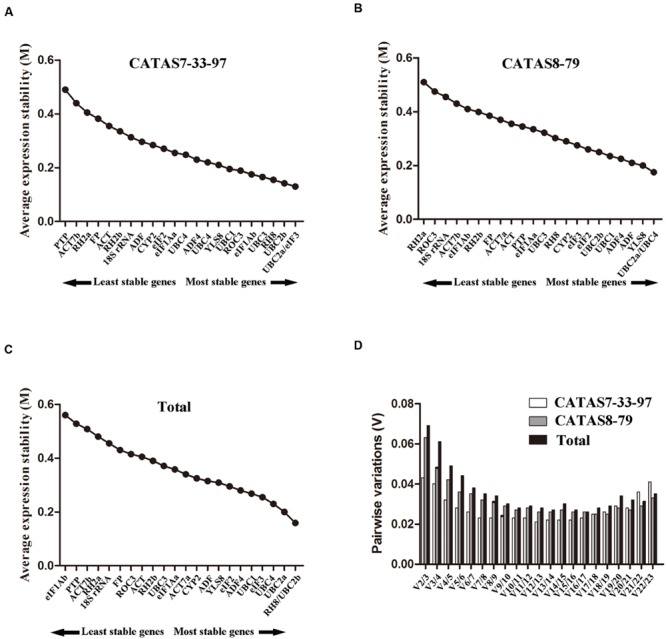
FIGURE 3.

Average gene expression stability (M) and pairwise variation (V) analyses of the candidate reference genes in different sample sets generated by the geNorm software. The ranking of the gene expression stability performed in CATAS7-33-97 (A), CATAS8-79 (B) and total sample (C). The most stable genes are on the right, and the least stable genes are on the left. (D) Pairwise variation calculated to determine the minimum number of reference genes for accurate normalization.
