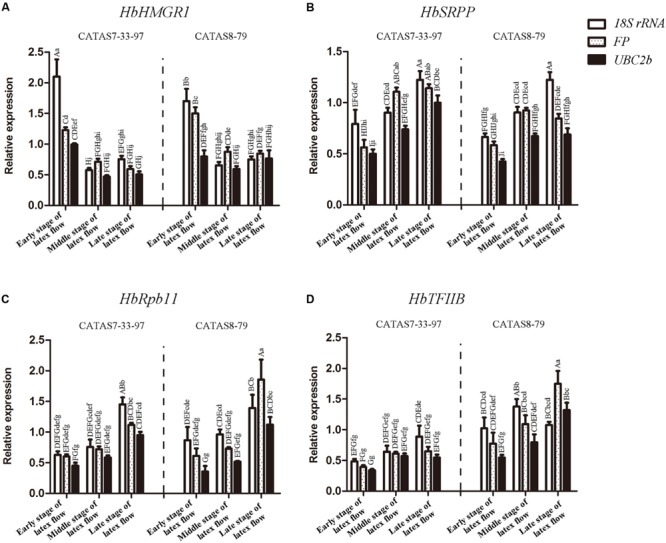
FIGURE 4.

Relative expression of HbHMGR1(A), HbSRPP(B), HbRpb11(C) and HbTFIIB(D) by using 18S rRNA, FP or UBC2b for normalization. Error bars for qRT-PCR showed the standard deviation of three replicates. Different letters indicate statistically significant difference in relative expression of each gene among different tissues. The capital letter represents p < 0.01 while lowercase represents p < 0.05. Analyses were performed with SPSS Statistics 17.0. Bars indicate the standard deviation of three biological replicates in triplicate.
