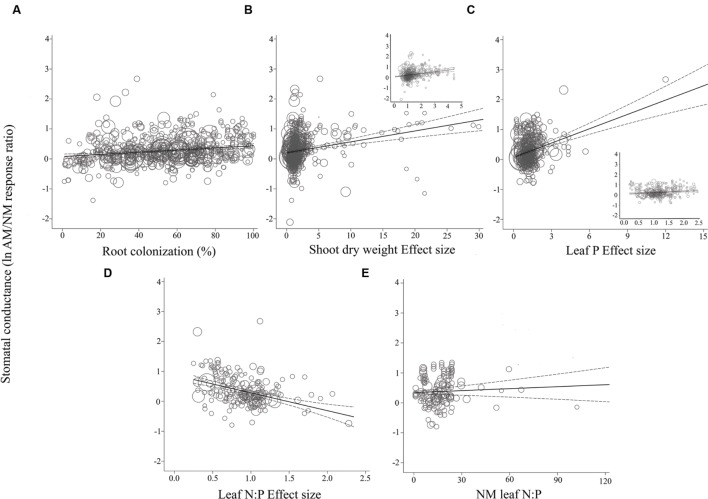
FIGURE 4.
Regression plots of the size of the AM-induced change in stomatal conductance (lnR gs) as a function of (A) percent root colonization; (B) AM/NM shoot DW effect size; (C) AM/NM leaf P effect size; (D) AM/NM leaf N:P effect size; (E) leaf N:P of NM plants. Darker center line is the model prediction; lighter lines are 95% confidence intervals. Each symbol represents one study, with symbol size indicating its weighting. Insets in (B) and (C) are expanded views of the ranges containing the majority of studies.

