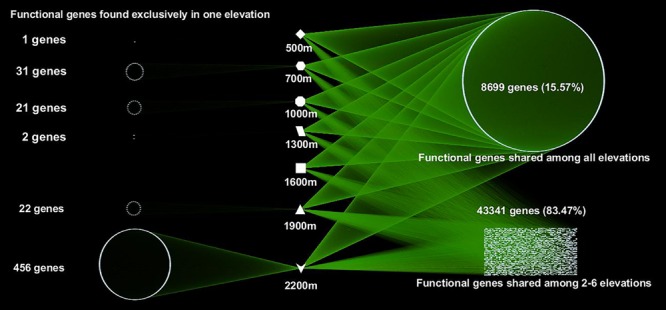
FIGURE 1.

A network map showing the interactions of microbial functional genes among all the samples from different elevations. Each point represents one independent functional gene. Functional genes in the left column were unique to one site, while those in the right belonged to multiple elevation sites.
